
FARTCOINUSDT – Probability Analysis for January 22, 2026
FARTCOIN/USDT Price Probability Analysis — January 22, 2026
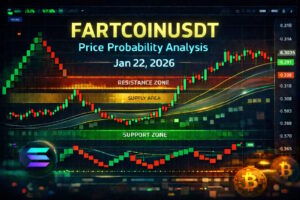
Live Price Update
As of today, FARTCOIN/USDT is trading around ~0.3035 USDT, with the most recent daily close near 0.3042 USDT and ongoing 24-hour fluctuation in the short squeeze band between approximate support near 0.2888 USDT and resistance near 0.3148 USDT on futures charts. (CoinMarketCap)
This post uses that live price data as the foundation for probability ranges across multiple timeframes, benchmarks like VWAP, supply/demand identification, sentiment conditions, and structural probability analysis.
Probability Analysis Methodology
Instead of deterministic price predictions, this analysis uses probability bands derived from:
- Price structure and clustered support/resistance levels
- Multi-Timeframe Confluence from ultra-short (15m) to long (Monthly)
- Estimated 24-Hour VWAP bias for intraday fair-value zones
- Renko trend filtering to highlight direction without noise
- Market sentiment and volume behavior
This approach helps frame likely directional ranges and conditional bias rather than fixed predictions in a volatile meme coin context.
15-Minute & 30-Minute Analysis
15-Minute (Ultra Short-Term)
With price oscillating near 0.3035 USDT, short-term calls are driven by liquidity and momentum spikes.
Bullish (~30-40%): Quick push toward 0.310–0.314 USDT if buyers hold near intraday support.
Neutral (~40-50%): Sideways movement inside 0.298–0.310 USDT.
Bearish (~20-30%): Drop beneath 0.295 USDT targets 0.288–0.292 USDT.
These narrow ranges are typical of short intervals in range markets.
30-Minute (Short-Term)
Similar dynamics persist on 30m.
Bullish (~35-45%): Strength above 0.310 opens 0.314–0.320 USDT.
Neutral (~40-50%): Choppy price between 0.295–0.310 USDT.
Bearish (~20-30%): Breakdown below 0.288 USDT sets sights on 0.280–0.285 USDT.
The 30m chart helps filter noise while showing early directional cues.
1-Hour & 4-Hour Analysis
1-Hour (Mid-Short Term)
On the 1H frame, price is compressing near mid-range bands with no clear breakout yet.
Bullish (~35-45%): Clear closes above 0.310 USDT could extend toward 0.320+ USDT.
Neutral (~40-50%): Between 0.290–0.310 USDT.
Bearish (~20–30%): Momentum below 0.288 USDT draws attention to deeper support.
4-Hour (Intermediate Term)
The 4H timeframe still reflects sideways structure after extended consolidation.
Bullish (~40%): If price reclaims 0.312–0.315 USDT on higher volume, run toward 0.330–0.340 USDT becomes possible.
Neutral (~40–50%): Continued range trade from ~0.270–0.315 USDT.
Bearish (~20–30%): Break and close below 0.270 USDT pushes deeper probability waves downward.
The intermediate term captures broader trader positioning.
Daily to Monthly Analysis
Daily Timeframe
The daily chart reflects range compression, influenced by recent downside pressure but with possible stability near stronger floors.
Bullish (~40%): Daily close above 0.310 USDT opens attention toward 0.335+ USDT.
Neutral (~40–50%): Sideways between 0.270–0.310 USDT.
Bearish (~20–30%): Failing major support near 0.270 USDT targets lower bounds.
Weekly & Monthly Timeframes
Longer frames show broad potential movement rather than direction certainty:
Weekly: Probabilities spread wider — a weekly close above 0.320 USDT gains stronger upside probability; below 0.260 USDT implies further downside.
Monthly: Meme coin ranges remain wide historically, emphasizing probability bands from deep support to higher swing levels rather than singular trend forecasts.
Renko Chart Trend Insight
Renko charts filter time to focus on genuine directional brick formations:
- Recently shown compressed bricks near current price levels (~0.300 USDT) indicate indecision after a downtrend.
- Lack of extended bullish bricks signals no confirmed uptrend yet.
- Supports around 0.270–0.280 USDT and resistances near 0.310–0.320 USDT align with Renko pressure patterns.
Renko helps highlight where structural bias is forming beyond noisy candlestick fluctuations.
Support, Demand & Supply Zones
Identifying key zones where price historically attracts or repels liquidity:
Demand / Support Areas
- 0.270–0.285 USDT — strong near-term demand where buyers historically step in.
- 0.245–0.260 USDT — deeper support if the near zone fails.
Supply / Resistance Areas
- 0.305–0.320 USDT — initial supply where rallies often stall.
- 0.330–0.350 USDT — broader supply cluster above short-term highs.
Support and resistance here represent clusters of orders and liquidity rather than precise points.
VWAP Bias (24-Hour Intraday Fair Value)
Although direct VWAP values are not accessible, we estimate a 24-hour fair value based on price clustering and recent ranges:
Estimated 24H VWAP Zone: 0.295–0.300 USDT
Analysis context:
- Price above VWAP: intraday bullish bias.
- Price near VWAP: balance between buyers and sellers.
- Price below VWAP: intraday bearish bias.
VWAP approximations offer insight into where the center of volume interest lies over the trading day.
Sentiment Analysis
Technical Sentiment: Neutral momentum with mild bearish bias as intraday and short-term indicators fail to show strong directional control on TradingView. (TradingView)
Market Sentiment: Broader crypto and meme coin sentiment remains mixed as FARTCOIN balances between speculative hold and trader rotation.
Community Sentiment: Some traders view sub-0.30 price levels as value accumulation zones, but others remain cautious due to prior breakdowns below psychological support. (Reddit)
Overall sentiment aligns with probability weighting toward neutrality with slight bearish lean unless strong catalyst appears.
Probability Bands Summary
| Timeframe | Bullish Target | Neutral Range | Bearish Target |
|---|---|---|---|
| 15 min | 0.310–0.314 | 0.298–0.310 | 0.288–0.295 |
| 30 min | 0.312–0.320 | 0.295–0.312 | 0.285–0.295 |
| 1 hr | 0.320–0.330 | 0.290–0.320 | 0.270–0.290 |
| 4 hr | 0.330–0.345 | 0.270–0.330 | 0.250–0.270 |
| Daily | 0.335–0.360 | 0.270–0.335 | 0.240–0.270 |
| Weekly | 0.350–0.380 | 0.250–0.350 | 0.220–0.250 |
| Monthly | 0.380–0.450+ | 0.220–0.380 | 0.180–0.220 |
These probability bands represent weighted likelihoods based on current structure, sentiment, and range behavior, not guaranteed outcomes.
Disclaimer
This content is educational and informational only. It does not constitute financial, investment, trading, tax, or professional advice. Cryptocurrency markets are highly volatile; always do your own research and consult qualified professionals before making financial decisions.
Please Follow & Subscribe To One Web One Hub
2026 Jan 22 FARTCOINUSDT FI
At One Web One Hub, we deliver daily live crypto probability analyses that go beyond simplistic predictions. Our insights combine real price data, multi-timeframe structure, demand/supply mapping, VWAP bias, Renko trends, and sentiment cues to empower better market understanding.
Bookmark our blog, share useful posts with your community, and return daily for fresh, actionable crypto education designed to help traders and enthusiasts navigate volatility with clarity.
One Web One Hub — your hub for crypto clarity in chaotic markets.
Previous Post FARTCOINUSDT – Probability Analysis for January 21, 2026
Next Post FARTCOINUSDT – Probability Analysis for January 23, 2026


