
FARTCOINUSDT – Probability Analysis for January 23, 2026
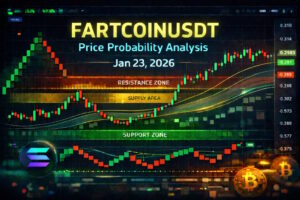
FARTCOIN/USDT Price Probability Analysis — January 23, 2026
Live Price Update
According to live crypto market data, FARTCOIN/USDT is currently trading around approximately $0.2985 USDT. The 24-hour range is approximately $0.2944 – $0.3107 USDT, reflecting relatively tight price action near the sub-$0.30 level. (CoinGecko)
This post uses that real-time price as the foundation for multi-timeframe probability analyses, demand–supply zone identification, Renko chart interpretation, sentiment context, VWAP bias estimation, and structural support and resistance observations.
How Our Probability Analysis Works
Rather than precise price predictions, this analysis uses probability bands informed by:
• Multi-Timeframe Confluence — aligning signals from 15m through Monthly charts
• Support & Resistance Clusters — zones where price consistently reacted historically
• Renko Chart Insight — filtering noise to see true price pressure
• VWAP Fair-Value Estimation — intraday bias without direct indicator access
• Sentiment & Volume Context — broader mood inferred from recent behavior
This provides realistic range probabilities rather than fixed target prices.
15-Minute and 30-Minute Probabilities
15-Minute Outlook
Short-term price action shows minor swing oscillations:
• Bullish (~30–40%): Rejection of support near $0.295 leads toward $0.302–$0.308
• Neutral (~40–50%): Consolidation between $0.295–$0.306
• Bearish (~20–30%): Breakdown below $0.292 opens probability toward $0.285–$0.290
30-Minute Outlook
This timeframe filters some noise but remains range-bound:
• Bullish (~35–45%): Break above $0.307 could extend toward $0.312–$0.318
• Neutral (~40–50%): Sideways between $0.292–$0.307
• Bearish (~20–30%): Below $0.290 sets lower probability toward $0.280–$0.290
These short frames reflect current sideways market compression near the baseline. (CoinGecko)
1-Hour and 4-Hour Outlook
1-Hour Chart
• Bullish (~35–45%): Price holding above short-term VWAP and key micro resistance could test $0.312–$0.318
• Neutral (~40–50%): Oscillation between $0.288–$0.306
• Bearish (~20–30%): Failure below $0.285 targets $0.275–$0.28
4-Hour Chart
• Bullish (~40%): Clear breach above $0.310 with volume lifts probability toward $0.325–$0.335
• Neutral (~40–50%): Consolidation between $0.270–$0.310
• Bearish (~20–30%): Break below major demand near $0.270 leads toward $0.25–$0.265
This reflects the range structure still dominating in the mid-term.
Daily, Weekly, and Monthly Outlook
Daily Chart
• Bullish (~40%): Strong daily close above $0.307 increases odds toward $0.330–$0.345
• Neutral (~40–50%): Price continues sideways $0.27–$0.31
• Bearish (~20–30%): Break below $0.27 targets $0.24–$0.26
Weekly and Monthly
Longer horizons see wider bands due to the volatility nature of meme coins:
• Weekly Bullish (~40%): Weekly close above the upper range opens broader swing interest
• Weekly Neutral (~40–50%): Extended sideways pressure from wider distribution zone
• Weekly Bearish (~20–30%): Extended breakdown toward deeper structural lows
Monthly probabilities widen further as macro sentiment and extended cycles influence ranges.
Renko Chart Interpretation
Renko charts simplify price movement by focusing on meaningful price changes and filtering out time noise:
• Currently compressed Renko bricks around $0.29–$0.30 reveal sideways compression.
• Lack of clear higher bricks above resistance suggests no committed bullish trend yet.
• Support large bricks near the $0.27 area align with deeper demand clusters.
This highlights indecision and the need for follow-through volume to break structural bias.
Support, Demand & Supply Zones
Demand / Support Levels
• $0.270–$0.285 USDT — primary near-term support cluster
• $0.245–$0.260 USDT — deeper structural demand if lower breakdown occurs
Supply / Resistance Levels
• $0.305–$0.318 USDT — active supply where rallies have stalled
• $0.330–$0.350 USDT — higher resistance above short-term highs
These zones reflect historically significant reaction areas, not exact price lines.
VWAP (24-Hour Bias Estimation)
While direct VWAP is not accessible, using recent price clustering allows approximation:
Estimated 24-Hour VWAP Zone: $0.295–$0.300 USDT
• Price above VWAP: intraday bullish bias
• Price near VWAP: balanced range trading
• Price below VWAP: intraday bearish tilt
VWAP estimates help indicate where intraday trading volume might weight fair value.
Market Sentiment Analysis
Technical Sentiment: Neutral with mild bearish tilt — short-term indicators show rangebound behavior without strong divergence.
Community Sentiment: Market mood among meme coin traders remains mixed within the low-price range, with some accumulation interest near psychological floors.
Volume Context: Modest volume reflects no breakout pressure, aligning with persistent sideways movement near baseline ranges.
Sentiment overall leans toward neutral-bearish with stabilization bias, pending a breakout catalyst.
Probability Bands Summary
| Timeframe | Bullish Target | Neutral Range | Bearish Target |
|---|---|---|---|
| 15 min | $0.310–$0.314 | $0.298–$0.310 | $0.285–$0.298 |
| 30 min | $0.312–$0.318 | $0.295–$0.312 | $0.280–$0.295 |
| 1 hr | $0.318–$0.330 | $0.288–$0.318 | $0.270–$0.288 |
| 4 hr | $0.325–$0.340 | $0.270–$0.325 | $0.250–$0.270 |
| Daily | $0.330–$0.345 | $0.27–$0.33 | $0.24–$0.27 |
| Weekly | $0.350–$0.380 | $0.25–$0.35 | $0.22–$0.25 |
| Monthly | $0.380–$0.45+ | $0.22–$0.38 | $0.18–$0.22 |
These bands reflect likelihood ranges based on structural context and sentiment, not exact guarantees.
Disclaimer
This content is educational and informational only and does not constitute financial, investment, trading, tax, or professional advice. Cryptocurrency markets are volatile; always perform your own research and consult qualified professionals before making financial decisions.
Please Follow & Subscribe To One Web One Hub — Your Crypto Clarity Center
2026 Jan 23 FARTCOINUSDT FI
At One Web One Hub, we provide daily probability-based crypto insights backed by real-life data, multi-timeframe structure, demand/supply mapping, sentiment context, Renko trend interpretation, and VWAP bias estimation to help you think more clearly about price behavior.
Bookmark our blog, share with your network, and return daily for fresh, analytical perspectives that help you trade and learn with confidence.
One Web One Hub — your hub for crypto clarity in chaotic markets.
Sources: Live price and range from CoinGecko’s FARTCOIN data showing current market conditions for Jan 23, 2026. (CoinGecko)
Previous Post FARTCOINUSDT – Probability Analysis for January 22, 2026
Next Post FARTCOINUSDT – Probability Analysis for January 25, 2026


