BITCOINUSDT – Probability Analysis for Jun 12, 2026
Bitcoin Price Forecast – June 12, 2026
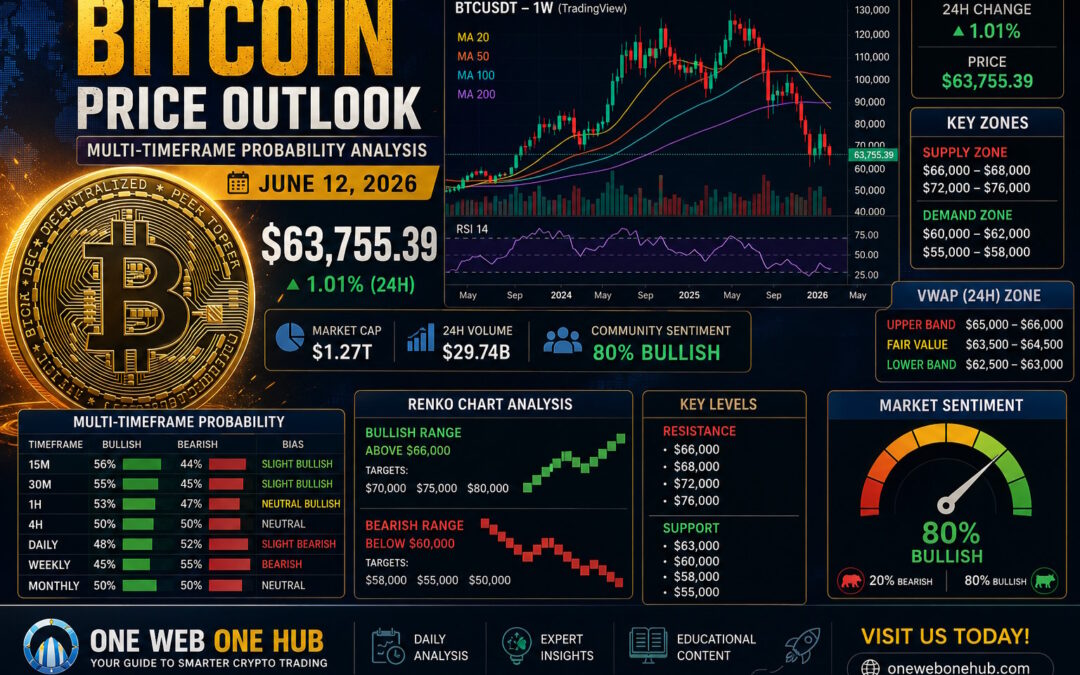
BTCUSDT Multi-Timeframe Probability Analysis, Renko Chart Analysis, VWAP Zones, Market Sentiment, and Key Trading Levels
Current Bitcoin Market Overview
Live BTCUSDT Price Context
Based on the latest chart data provided, Bitcoin (BTCUSDT) is trading around $63,755, recovering modestly after a significant decline from the $110K–$120K region visible on the weekly timeframe.
Current Market Statistics:
- BTC Price: $63,755
- 24H Change: +1.01%
- Market Cap: $1.27 Trillion
- 24H Volume: $29.74 Billion
- Community Sentiment: 80% Bullish
Market Structure Overview
The weekly chart shows Bitcoin trading beneath major moving averages, indicating that the broader trend remains under pressure despite recent stabilization.
Current observations:
- Weekly support forming near $60K–$62K.
- Price attempting recovery from lower Bollinger Band support.
- RSI recovering from oversold territory.
- Buyers defending psychological support around $60K.
This suggests a market transitioning from panic selling into a potential accumulation phase.
BTCUSDT Multi-Timeframe Probability Analysis
15-Minute Timeframe Analysis
Bullish Scenario – Probability 56%
If BTC remains above $63,500:
Targets:
- $64,500
- $65,200
- $66,000
Bearish Scenario – Probability 44%
If sellers reclaim intraday control:
Targets:
- $62,800
- $62,000
- $61,200
30-Minute Timeframe Analysis
Bullish Scenario – Probability 55%
Sustained trading above $64,000:
Targets:
- $65,500
- $66,800
- $68,000
Bearish Scenario – Probability 45%
Failure below support:
Targets:
- $62,000
- $61,000
- $60,000
1-Hour Timeframe Analysis
Bullish Scenario – Probability 53%
Momentum recovery develops:
Targets:
- $66,500
- $68,500
- $70,000
Bearish Scenario – Probability 47%
Recovery fails:
Targets:
- $61,500
- $60,000
- $58,500
4-Hour Timeframe Analysis
Bullish Scenario – Probability 50%
Break above immediate resistance:
Targets:
- $68,000
- $70,500
- $73,000
Bearish Scenario – Probability 50%
Support breakdown:
Targets:
- $60,000
- $58,000
- $55,000
The 4H timeframe remains balanced between recovery and continuation.
Daily Timeframe Analysis
Bullish Scenario – Probability 48%
Daily close above $68,000:
Targets:
- $72,000
- $76,000
- $80,000
Bearish Scenario – Probability 52%
Continued macro weakness:
Targets:
- $58,000
- $55,000
- $50,000
Weekly Timeframe Analysis
Bullish Scenario – Probability 45%
Long-term accumulation succeeds:
Targets:
- $75,000
- $85,000
- $95,000
Bearish Scenario – Probability 55%
Weekly trend remains bearish:
Targets:
- $58,000
- $52,000
- $45,000
Monthly Timeframe Analysis
Bullish Macro Scenario – Probability 50%
Bitcoin resumes long-term growth cycle:
Targets:
- $100,000
- $120,000
- $150,000
Bearish Macro Scenario – Probability 50%
Extended correction phase:
Targets:
- $50,000
- $42,000
- $35,000
Renko Chart Analysis
Current Renko Structure
The recent decline from the $80K–$120K region generated a strong bearish Renko sequence.
Current Renko Status:
- Bearish trend weakening
- First signs of stabilization
- Potential accumulation zone emerging
Bullish Renko Range
Confirmation Above:
- $66,000
Potential Targets:
- $70,000
- $75,000
- $80,000
Bearish Renko Range
Breakdown Below:
- $60,000
Potential Targets:
- $58,000
- $55,000
- $50,000
Demand and Supply Zones
Major Demand Zones
Primary Demand:
- $60,000 – $62,000
Secondary Demand:
- $55,000 – $58,000
Macro Demand:
- $48,000 – $52,000
Major Supply Zones
Immediate Supply:
- $66,000 – $68,000
Major Supply:
- $72,000 – $76,000
Macro Supply:
- $80,000 – $90,000
Support and Resistance Levels
Key Support Levels
- $63,000
- $60,000
- $58,000
- $55,000
Key Resistance Levels
- $66,000
- $68,000
- $72,000
- $76,000
VWAP Analysis
Estimated 24H VWAP Zone
Based on visible price distribution and volume structure:
Lower VWAP Band:
- $62,500 – $63,000
Fair Value Zone:
- $63,500 – $64,500
Upper VWAP Band:
- $65,000 – $66,000
VWAP Interpretation
Price Below VWAP:
- Bearish pressure remains active
Price Near VWAP:
- Fair value trading zone
Price Above VWAP:
- Buyers gaining short-term control
Current positioning suggests BTC is attempting to reclaim fair value after a sharp decline.
Market Sentiment Analysis
Current Sentiment Overview
Community data remains strongly optimistic:
- Bullish: 80%
- Bearish: 20%
However, technical indicators remain cautious.
Sentiment Price Zones
Bullish Sentiment Zone
- $66,000 – $75,000
Neutral Sentiment Zone
- $62,000 – $66,000
Bearish Sentiment Zone
- $50,000 – $62,000
The disconnect between sentiment and trend indicates volatility may remain elevated.
Basis of Probability Modeling
Methodology Used
Multi-Timeframe Analysis
Trend confirmation across all major timeframes.
Market Structure Analysis
Support and resistance evaluation.
Renko Trend Filtering
Momentum identification.
VWAP Estimation
Institutional fair-value assessment.
Demand and Supply Mapping
Liquidity concentration zones.
Volume Confirmation
Participation and conviction analysis.
Sentiment Overlay
Crowd psychology and positioning.
The probabilities are derived by combining these factors to estimate the most likely future scenarios rather than predict exact outcomes.
Bitcoin Market Outlook Summary
Most Probable Trading Range
Expected trading range over the coming sessions:
- $60,000 – $70,000
Bullish Confirmation Level
Break and hold above:
- $68,000
Potential upside:
- $72,000
- $76,000
- $80,000
Bearish Confirmation Level
Break below:
- $60,000
Potential downside:
- $58,000
- $55,000
- $50,000
Bitcoin remains at a critical decision point where both accumulation and further downside remain possible.
Educational Disclaimer
This content is intended solely for educational and informational purposes and should not be interpreted as financial, investment, or trading advice. Cryptocurrency markets are highly volatile and carry substantial risk. Always conduct your own research and consult a qualified financial professional before making investment decisions.
Explore More at One Web One Hub

12 Jun 2026 BITCOINUSDT (Referral Link)
Stay Ahead of Cryptocurrency Markets
At One Web One Hub, readers gain access to:
- Daily Bitcoin market forecasts
- Advanced technical analysis
- Renko and VWAP educational content
- Probability-based market outlooks
- Trading psychology insights
- Cryptocurrency market research
Join the One Web One Hub Community
Successful traders understand that consistency comes from knowledge, preparation, and discipline.
Bookmark One Web One Hub today and return daily for professional cryptocurrency analysis designed to help you navigate changing market conditions with confidence.
The next major Bitcoin move may be closer than you think—and staying informed could make all the difference.
Previous Post BITCOINUSDT – Probability Analysis for Jun 05, 2026


