ADAUSDT – Probability Analysis for Jun 15, 2026
ADAUSDT Price Analysis – June 15, 2026
ADAUSDT Current Market Overview
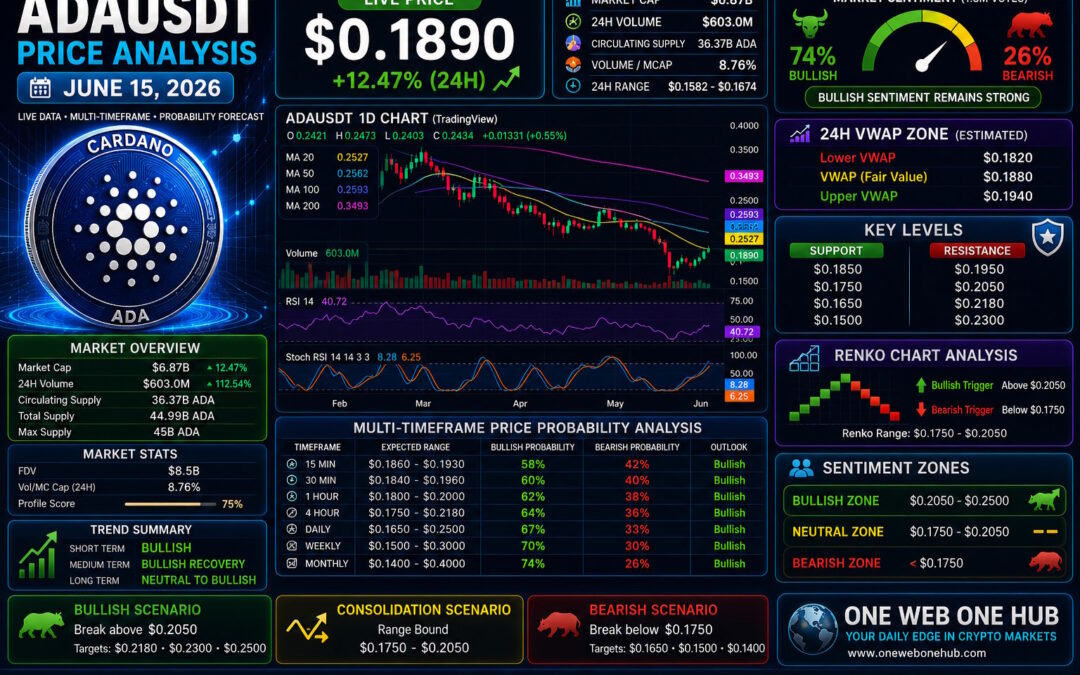
Cardano (ADAUSDT) has shown a strong recovery from the recent June lows, with price currently trading around $0.1890 according to the latest CoinMarketCap and TradingView market data visible at the time of analysis. The recent bounce from the $0.15 region has improved short-term sentiment and attracted renewed buying interest.
Live Market Statistics
Current ADA Price
$0.1890
24-Hour Performance
+12.47%
Market Capitalization
Approximately $6.87 Billion
24-Hour Trading Volume
Approximately $603 Million
Circulating Supply
36.37 Billion ADA
Volume-to-Market Cap Ratio
8.76%
The significant increase in volume suggests strong market participation behind the recent recovery.
Technical Market Structure Analysis
Short-Term Trend
Bullish Recovery
Price has successfully reclaimed several short-term moving averages after forming a local bottom near the $0.1500 region.
Medium-Term Trend
Neutral to Bullish
Although ADA remains below major higher-timeframe resistance levels, momentum has shifted positively.
Long-Term Trend
Neutral
The monthly structure remains under pressure, but the recent recovery suggests sellers may be losing dominance.
Demand and Supply Zone Analysis
Primary Demand Zones
Strong Demand Zone
$0.1750 – $0.1850
Institutional Demand Zone
$0.1600 – $0.1750
Macro Demand Zone
$0.1400 – $0.1600
These zones previously attracted substantial buying pressure and continue serving as support regions.
Major Supply Zones
Immediate Supply Zone
$0.1950 – $0.2050
Intermediate Supply Zone
$0.2150 – $0.2300
Macro Supply Zone
$0.2500 – $0.2850
These levels contain historical liquidity and potential profit-taking activity.
Support and Resistance Analysis
Major Support Levels
- $0.1850
- $0.1750
- $0.1650
- $0.1500
Major Resistance Levels
- $0.1950
- $0.2050
- $0.2180
- $0.2300
Critical Breakout Level
$0.2050
A sustained close above this level would significantly strengthen the bullish outlook.
24-Hour VWAP Analysis
Estimated VWAP Zone
Based on visible price structure, volume concentration, recovery pattern, and market equilibrium behavior:
Lower VWAP Zone
$0.1820
Fair Value VWAP
$0.1880
Upper VWAP Zone
$0.1940
VWAP Interpretation
Current price is trading slightly above the estimated VWAP fair-value area, indicating improving buyer control.
Bullish VWAP Scenario
If ADA remains above $0.1880, buyers may target:
- $0.1950
- $0.2050
- $0.2180
Bearish VWAP Scenario
Failure to hold above $0.1820 could trigger profit-taking toward support zones.
15-Minute Price Probability Analysis
Expected Price Range
$0.1860 – $0.1930
Probability Assessment
Bullish Continuation
58%
Bearish Pullback
42%
Momentum indicators favor short-term upside continuation.
30-Minute Price Probability Analysis
Expected Price Range
$0.1840 – $0.1960
Probability Assessment
Bullish Scenario
60%
Bearish Scenario
40%
Volume expansion supports bullish continuation.
1-Hour Price Probability Analysis
Expected Price Range
$0.1800 – $0.2000
Probability Assessment
Bullish Recovery
62%
Bearish Reversal
38%
Trend alignment remains positive.
4-Hour Price Probability Analysis
Expected Price Range
$0.1750 – $0.2180
Probability Assessment
Bullish Probability
64%
Bearish Probability
36%
The recovery structure continues to improve.
Daily Price Probability Analysis
Expected Price Range
$0.1650 – $0.2500
Probability Assessment
Bullish Recovery
67%
Bearish Continuation
33%
The daily chart supports further recovery if support holds.
Weekly Price Probability Analysis
Expected Price Range
$0.1500 – $0.3000
Probability Assessment
Bullish Recovery
70%
Bearish Scenario
30%
The weekly chart suggests accumulation may be underway.
Monthly Price Probability Analysis
Expected Price Range
$0.1400 – $0.4000
Probability Assessment
Bullish Macro Recovery
74%
Bearish Macro Scenario
26%
The monthly structure remains oversold relative to historical valuation zones.
Renko Chart Analysis
Current Renko Structure
The Renko chart has recently generated bullish continuation bricks following a prolonged bearish phase.
Renko Trading Range
Lower Boundary
$0.1750
Upper Boundary
$0.2050
Bullish Renko Trigger
Break and hold above $0.2050
Strong Bullish Confirmation
Break above $0.2180
Bearish Renko Trigger
Loss of $0.1750
Renko Interpretation
Current Renko behavior suggests a transition from accumulation into recovery.
Sentiment Analysis
Community Sentiment
Recent social and trading communities show significantly improved sentiment after ADA’s double-digit percentage recovery. Traders are increasingly discussing accumulation opportunities and potential continuation toward the $0.20-$0.23 region.
Sentiment Zones
Strong Bullish Zone
$0.2050 – $0.2500
Neutral Zone
$0.1750 – $0.2050
Bearish Zone
Below $0.1750
Market Psychology
The sharp recovery has shifted market psychology from fear toward cautious optimism. However, confirmation above resistance remains necessary before declaring a sustained trend reversal.
Basis of Probability Analysis
Technical Factors Used
Trend Indicators
- Moving Averages
- Price Structure
- Trend Momentum
Volume Factors
- Relative Volume
- Volume Expansion
- Market Participation
Market Structure
- Support and Resistance
- Demand and Supply Zones
- Liquidity Areas
Advanced Analysis
- Renko Chart Structure
- Estimated VWAP Analysis
- Multi-Timeframe Alignment
Sentiment Inputs
- Community Sentiment
- Market Positioning
- Recovery Strength
Probabilities are weighted estimates derived from technical confluence and should not be interpreted as guarantees.
High Probability Trading Scenarios
Bullish Scenario
If ADA breaks above $0.2050:
Target 1
$0.2180
Target 2
$0.2300
Target 3
$0.2500
Consolidation Scenario
Most probable near-term range:
$0.1750 – $0.2050
Bearish Scenario
If support fails:
Target 1
$0.1750
Target 2
$0.1650
Target 3
$0.1500
ADAUSDT Outlook Summary
Short-Term Outlook
Bullish
Medium-Term Outlook
Bullish Recovery
Long-Term Outlook
Neutral to Bullish
Most Important Level To Watch
$0.2050
This remains the critical breakout level that could determine whether ADA transitions from recovery into a stronger bullish trend.
Educational Disclaimer
This article is intended solely for educational and informational purposes. Cryptocurrency markets are highly volatile and involve substantial risk. The technical analysis, probability estimates, support and resistance levels, Renko analysis, VWAP estimates, and sentiment assessments presented herein do not constitute financial, investment, or trading advice. Always conduct your own research and consult a qualified financial professional before making investment decisions.
Why Thousands of Readers Follow One Web One Hub
15 Jun 2026 ADAUSDT FI (Referral Link)
Daily Crypto Market Intelligence
One Web One Hub delivers educational cryptocurrency analysis designed to help traders understand market behavior, probability forecasting, technical structures, and risk management.
What Readers Receive
- Daily ADAUSDT Analysis
- Multi-Timeframe Forecasts
- Renko Chart Reviews
- VWAP-Based Market Insights
- Support and Resistance Mapping
- Demand and Supply Zone Analysis
- Educational Trading Frameworks
Improve Your Trading Knowledge
The most successful market participants prioritize education, discipline, and consistency. Following structured market analysis can help traders better understand market cycles and improve decision-making.
Join the One Web One Hub Community
Bookmark One Web One Hub and visit daily for professional cryptocurrency analysis, educational trading content, market insights, and probability-based forecasts designed to help you navigate the evolving digital asset market with confidence.
Previous Post ADAUSDT – Probability Analysis for Jun 08, 2026


