
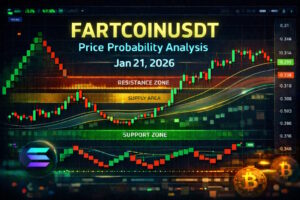
FARTCOINUSDT – Probability Analysis for January 21, 2026
FARTCOIN/USDT Price Probability & Multi-Timeframe Analysis — Jan 21, 2026
Live Price Snapshot
As of today, FARTCOIN/USDT is trading near ~$0.2935 USDT, with a projected 24-hour low around $0.2908 and high near $0.3141 USDT depending on exchange data. (CoinCodex)
This live price forms the basis for the probability and structural analysis below — updated for Jan 21, 2026.
Basis of Probability Analysis
Instead of predicting exact price outcomes, this blog uses probability bands constructed from:
- Multi-Timeframe Confluence: Converging signals from 15m, 30m, 1H, 4H, daily, weekly and monthly charts.
- Support & Resistance Clusters: Zones where price historically reacts and consolidates. (One Web One Hub)
- Estimated 24H VWAP Zone: A snapshot for where intraday buyers and sellers likely balance.
- Renko Chart Filtering: Helps distinguish structural direction from short-term noise.
- Sentiment & Volume Dynamics: Gauging trader behavior and market mood.
This structure yields probability-based ranges rather than absolute price forecasts.
Multi-Timeframe Probability Analysis
15-Minute & 30-Minute (Intraday)
Short timeframes show tight range activity due to low volatility:
- Bullish (~30–40%): Quick bounce toward $0.30–$0.305 USDT if buyers defend near current support.
- Neutral (~40–50%): Sideways range between $0.292–$0.303 USDT.
- Bearish (~20–30%): Failure below $0.29 USDT leads toward $0.284–$0.28 USDT.
These reflect short-term market noise and frequent rejections seen in intraday price action.
1-Hour & 4-Hour (Short/Medium Term)
Intermediate timeframes show a broader sideways structure:
- Bullish (~35–45%): Cleared short-term resistance around $0.305–$0.31 USDT could lift price toward $0.32–$0.33 USDT.
- Neutral (~40–50%): Consolidation across $0.285–$0.305 USDT.
- Bearish (~20–30%): Breakdown under $0.28 USDT may reach $0.26–$0.275 USDT.
Mid-term structure reflects congestion typical of meme coins without strong volume catalysts.
Daily Timeframe
Daily patterns show rangebound behavior with slight downward bias:
- Bullish (~35–45%): Daily close above $0.31 USDT supports lift toward $0.335–$0.35 USDT.
- Neutral (~40–50%): Between $0.27–$0.312 USDT.
- Bearish (~20–30%): Failure below $0.27 USDT could push toward $0.25–$0.265 USDT.
Daily range compression suggests indecision until volume drivers arrive.
Weekly & Monthly Timeframes
Longer horizons widen the context:
- Weekly Bullish (~40%): Break above $0.33–$0.35 USDT could reveal broader recovery.
- Weekly Neutral (~40–50%): Sideways between $0.24–$0.33 USDT.
- Weekly Bearish (~20–30%): Extended weakness could reach deeper demand near $0.20–$0.24 USDT.
Monthly structures reflect meme coin volatility spikes and sentiment swings over macro cycles.
Renko Chart Analysis
Renko charts focus exclusively on price movement thresholds (ignoring time) to detect structural direction:
- Compression bricks near current zone (~$0.29) reflect indecision and consolidation.
- Lack of sustained upward Renko blocks above recent short-term resistance suggests bullish momentum remains muted.
- Support bricks cluster near lower levels (~$0.275–$0.28), which correspond with reaction lows seen recently. (One Web One Hub)
Renko filtering helps distinguish whether price is range-bound or trending.
Support, Demand & Supply Zones
Based on chart data and historical reactions:
Demand / Support Zones
- $0.27–$0.29 USDT: near-term demand cluster. (One Web One Hub)
- $0.24–$0.26 USDT: deeper structural support where buyers previously emerged. (One Web One Hub)
Supply / Resistance Zones
- $0.305–$0.325 USDT: immediate seller zone where recent rallies stalled. (One Web One Hub)
- $0.33–$0.36 USDT: higher timeframe supply region seen across multiple offers. (One Web One Hub)
These zones serve as areas of concentrated order flow rather than exact magnets.
Sentiment Analysis
Technical Sentiment: Neutral-to-bearish with recent downward bias; indicators on TradingView often reflect consolidation without clear directional dominance. (TradingView)
Market Sentiment: Meme coin sectors often follow risk appetite and broader market flows — currently mixed to cautious. Community signals from sentiment trackers also show balance between holders and short-term sellers. (CoinGecko)
Overall, sentiment is neutral-leaning bearish, consistent with range pressure.
VWAP Analysis (24-Hour Intraday Bias)
Access to direct VWAP metrics is limited, but we can estimate a 24-hour fair-value zone based on recent intraday concentration and price clustering:
👉 Estimated 24H VWAP Zone: $0.292–$0.300 USDT
Interpretation:
- Price above this zone: short-term intraday bullish bias.
- Price within this zone: balanced traders, range environment.
- Price below this zone: bearish intraday momentum.
VWAP helps identify where most intraday volume is likely balanced.
Probability Bands Summary
| Timeframe | Bullish Target | Neutral Range | Bearish Target |
|---|---|---|---|
| 15 min | $0.30–$0.305 | $0.292–$0.30 | $0.28–$0.292 |
| 30 min | $0.305–$0.312 | $0.29–$0.305 | $0.275–$0.29 |
| 1 H | $0.312–$0.33 | $0.285–$0.312 | $0.265–$0.285 |
| 4 H | $0.33–$0.35 | $0.275–$0.33 | $0.25–$0.275 |
| Daily | $0.335–$0.36 | $0.27–$0.335 | $0.24–$0.27 |
| Weekly | $0.35–$0.40 | $0.24–$0.35 | $0.20–$0.24 |
| Monthly | $0.38–$0.45+ | $0.22–$0.38 | $0.18–$0.22 |
These reflect weighted likelihood scenarios, not guarantees, based on structural and sentiment data.
Disclaimer
This content is educational and informational only and does not constitute financial, trading, investment, or professional advice. Always perform your own research and consult qualified professionals before making financial decisions.
Please Follow & Subscribe & Stay Ahead with One Web One Hub
2026 Jan 21 FARTCOINUSDT FI
At One Web One Hub, we provide daily live crypto probability analyses with a focus on real data, multi-timeframe insights, market psychology, and structural price behavior. Bookmark our blog, share with your community, and return daily for fresh perspectives that help you understand volatile markets with clarity.
One Web One Hub — your hub for crypto clarity in chaotic markets.
Sources:
• Live price data near $0.2935 USDT from aggregators showing range and trading activity. (CoinCodex)
• Support and resistance patterns from historical zones. (One Web One Hub)
• TradingView sentiment context. (TradingView)
Previous Post FARTCOINUSDT – Probability Analysis for January 20, 2026
Next Post FARTCOINUSDT – Probability Analysis for January 22, 2026


