
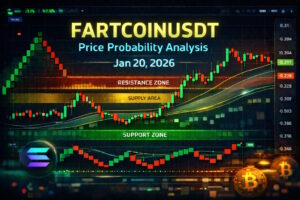
FARTCOINUSDT – Probability Analysis for January 20, 2026
FARTCOIN/USDT Price Probability & Multi-Timeframe Analysis — Jan 20, 2026
Live Price Snapshot
Recent multi-exchange live price indications show FARTCOIN/USDT trading around $0.28–$0.30 USDT with 24-hour trading ranges displaying lows near ~0.28 and highs near ~0.304 USDT in the spot and perpetual markets. (coinalyze.net)
This updated real-time price becomes the foundation for today’s probability forecasting across key timeframes.
Basis of Probability Analysis
Rather than signaling exact price targets, this post uses probability bands derived from:
- Support & Resistance Clustering — areas where price historically pauses or reverses.
- Multi-Timeframe Confluence — overlapping signals on 15m, 30m, 1H, 4H, daily, weekly, and monthly charts.
- VWAP Fair-Value Proxy — estimated 24-hour volume-weighted average price range for intraday bias.
- Renko Chart Insight — structural trend filtering beyond time-based candlesticks.
- Sentiment and Volume Context — gauging trader conviction from market behavior.
This approach prioritizes range probabilities over rigid predictions — especially necessary in volatile, low-liquidity assets like meme coins.
Multi-Timeframe Probability Forecast
15-Minute & 30-Minute Analysis
Short-term frames suggest tight range action:
- Bullish (~30–40%): Intraday bounce targeting $0.295–$0.305 if buyers defend near current support.
- Neutral (~40–50%): Consolidation range between $0.285–$0.298.
- Bearish (~20–30%): Break below $0.28 could spur sell-offs toward $0.275–$0.268.
These brief frames reflect short-term noise and frequent back-and-forth momentum.
1-Hour & 4-Hour Outlook
Mid-term fluctuation illustrates broader range:
- Bullish (~30–40%): Clear closes above $0.30–$0.305 may extend toward $0.31–$0.32.
- Neutral (~40–50%): Sideways price between $0.278–$0.305.
- Bearish (~20–30%): Sustained weakness below $0.275 could push lower probability bands near $0.26–$0.27.
These timeframes reflect pressure to resist a stronger trend absent strong volume flows.
Daily Timeframe
Daily price action remains range-driven:
- Bullish (~30–40%): Strong daily close above $0.305–$0.31 opens a potential move toward $0.32–$0.335.
- Neutral (~40–50%): Sideways compression in $0.27–$0.305.
- Bearish (~20–30%): Failure under $0.27 may target deeper support near $0.245–$0.255.
The daily chart is not yet displaying a decisive trend breakout due to range congestion.
Weekly & Monthly Forecasts
On higher horizons:
- Weekly Bullish (~35–45%): Break above mid-$0.30s could fuel optimism toward $0.345+.
- Weekly Neutral (~40–50%): Extended lateral movement between $0.25–$0.32.
- Weekly Bearish (~15–25%): Downside pressure leading to previous cycle lows near $0.22–$0.24.
Monthly outlooks on meme coins often capture large swings driven by sentiment shifts rather than fundamentals.
Renko Chart Insights
Renko, which filters time and focuses on significant price moves, reveals:
- Compression near current range (~$0.28–$0.30) — indicating indecision after breakdown from prior higher ranges.
- No confirmable uptrend yet — as upward Renko bricks are limited and do not show a clear structural breakout.
- Support alignment around ~$0.27–$0.28, echoing demand clusters seen on conventional charts.
This adds structural clarity beyond traditional candlesticks.
Support, Demand & Supply Zones
Using recent price clusters and reactions:
Demand / Support Zones
- $0.24–$0.27 USDT — deeper buyers historically stepped in here during downward cycles.
- $0.27–$0.28 USDT — near-term support where range rebound attempts have occurred.
Supply / Resistance Zones
- $0.295–$0.31 USDT — first major supply band where rallies have been capped.
- $0.315–$0.335+ USDT — broader supply zone if breakouts occur.
Support and resistance areas reflect liquidity pockets and order flow clusters.
Sentiment Analysis
Technical Sentiment: Range-neutral with slight bearish pressure due to recent breakdowns under prior support.
Market Sentiment: Meme coins like FARTCOIN are highly sentiment-driven; drops below key levels often amplify fear before potential stabilization.
Community Signals: Public discourse shows cautious positioning and reduced leverage appetite given recent volatility and lower price structure. (Reddit)
Net sentiment currently leans toward neutral-bearish with stabilization bias unless a sustained bounce above key resistance occurs.
VWAP — 24-Hour Intraday Bias
Without direct indicator access but based on recent trading activity and price clustering:
👉 Estimated 24-Hour VWAP Zone: $0.285–$0.295 USDT
Interpretation:
- Price above this zone: short-term intraday bullish bias.
- Price within this zone: balance between buyers and sellers.
- Price below this zone: intraday bearish drift.
VWAP helps visualize where intraday trading volume might weight price fair value.
Probability Bands Summary
| Timeframe | Bullish Target | Neutral Range | Bearish Target |
|---|---|---|---|
| 15m | $0.295–$0.305 | $0.285–$0.295 | $0.268–$0.285 |
| 30m | $0.298–$0.31 | $0.284–$0.298 | $0.268–$0.284 |
| 1H | $0.31–$0.32 | $0.278–$0.31 | $0.26–$0.278 |
| 4H | $0.32–$0.335 | $0.275–$0.32 | $0.25–$0.275 |
| Daily | $0.335–$0.355 | $0.27–$0.335 | $0.245–$0.27 |
| Weekly | $0.34–$0.37 | $0.25–$0.34 | $0.22–$0.25 |
| Monthly | $0.38–$0.45+ | $0.24–$0.38 | $0.18–$0.24 |
These probability bands represent weighted likelihoods derived from multi-timeframe structural patterns, not guarantees.
Disclaimer
This content is educational and informational only. It does not constitute financial, investment, trading, or tax advice. Always do your own research and consult qualified professionals before making financial decisions.
Please Follow & Subscribe & Grow with One Web One Hub
2026 Jan 20 FARTCOINUSDT FI
At One Web One Hub, we bring you daily cryptocurrency probability analyses, real-time insights, and multi-timeframe breakdowns built to help you understand volatile markets more clearly.
Bookmark the blog, share with others, and come back each day for fresh updates that help you navigate price dynamics with confidence.
One Web One Hub — your hub for crypto clarity in chaotic markets.
Citations:
Live price and exchange conversion fundamentals from Coinbase price converter showing FARTCOIN below $0.30 USDT. (Coinbase)
Live trading ranges from aggregated FARTCOIN price feeds across multiple exchanges. (coinalyze.net)
Previous Post FARTCOINUSDT – Probability Analysis for January 19, 2026
Next Post FARTCOINUSDT – Probability Analysis for January 21, 2026


