
FARTCOINUSDT – Probability Analysis for January 19, 2026
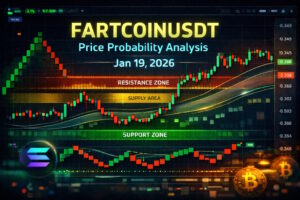
FARTCOIN/USDT Price Probability & Multi-Timeframe Analysis — Jan 19, 2026
Live Market Snapshot
As of the most recent chart updates on TradingView, FARTCOIN/USDT is trading around $0.3438 USDT, showing a downtrend over the last week with price declining ~7.6% in that period. (TradingView)
This updated live price — and the recent range extending from a low near $0.31 USDT into the mid-$0.30s — will be the foundation for our probability-based analysis across multiple time horizons.
Probability Analysis Methodology
Rather than forecasting specific price targets, this analysis uses probability bands. These are grounded in:
- Support & Resistance Clustering — areas where price has reacted repeatedly on TradingView and exchange order books. (One Web One Hub)
- Multi-Timeframe Structure (15m → Monthly) — aligning patterns across time frames to weigh probabilities.
- VWAP Estimation — a 24-hour volume-weighted average price proxy based on recent price action, indicating fair value intraday.
- Renko Chart Simplification — highlights structural pressure while filtering short-term noise.
- Sentiment & Volume Conditions — to understand trader conviction and directional likelihood.
These layers help define probability bands of possible price behaviors rather than fixed price predictions.
Multi-Timeframe Price Probability Outlook
15-Minute & 30-Minute
Short intervals show intraday noise and volatility:
- Bullish (~30–40%): Bounce toward $0.355–$0.365 USDT if buyers defend near current support.
- Neutral (~40–50%): Sideways trading between $0.345–$0.360 USDT.
- Bearish (~20–30%): Failure below $0.34 USDT could slide into $0.333–$0.330 USDT.
These ranges reflect short-term consolidation and quick retracement patterns typical of low-liquidity meme coins.
1-Hour & 4-Hour
Mid-term structure highlights broader trends:
- Bullish (~35–45%): Sustained closes above $0.355 USDT may test $0.365–$0.375 USDT.
- Neutral (~40–50%): Price oscillation within $0.335–$0.355 USDT.
- Bearish (~20–30%): Breaking $0.33 USDT signals deeper retrace opportunities near $0.31–$0.325 USDT.
This mid-range outlook reflects mixed momentum and structural congestion.
Daily Chart
Daily action shows range compression after recent downward moves:
- Bullish (~35–45%): Daily close above $0.37–$0.38 USDT could open the kite toward $0.39–$0.40 USDT.
- Neutral (~40–50%): Continuation within $0.33–$0.38 USDT.
- Bearish (~20–30%): Failure below $0.33 USDT extends toward $0.31–$0.32 USDT.
Long wicks and repeated rejections indicate uncertainty, not definitive trend.
Weekly & Monthly
Higher time frames frame broader ranges:
- Weekly Bullish (~40%): A weekly close above structural resistance (mid-$0.30s) suggests a recovery pattern.
- Weekly Neutral (~40%): Slow sideways price compression with no directional breakout.
- Weekly Bearish (~20%): Sustained weakness leading to deeper tests near $0.29–$0.30 USDT.
Monthly cycles show typical meme coin volatility — broad swings up and down with macro sentiment swings.
Renko Chart Interpretation
Renko charts highlight structural pressure more clearly than time-based candlesticks:
- Compression bricks near current range (~$0.34) reflect indecision, reinforcing sideways bias.
- Lack of sustained upward bricks above mid-$0.30s suggests bearish pressure still present.
- Brick clusters near $0.31–$0.33 USDT coincide with demand zones where buyers have previously stepped in. (One Web One Hub)
This structural view reduces short-term noise and clarifies support/resistance behavior.
Support, Demand & Supply Zones
Demand (Support) Zones
- $0.29–$0.32 USDT — strong near-term demand where price has previously rebounded. (One Web One Hub)
- Deeper support: $0.26–$0.29 USDT if sellers intensify.
Supply (Resistance) Zones
- $0.345–$0.365 USDT — active supply band where price rejections frequent. (One Web One Hub)
- Broader resistance: $0.38–$0.40 USDT if strength returns.
Key Structural Pivots:
- Mid Range (~$0.35 USDT) stands as psychological pivot between demand and supply.
These zones help guide risk management and potential entry/exit areas for traders.
VWAP (24-Hour Fair Value Zone)
Although we don’t have direct VWAP indicator values, we can approximate the 24-hour VWAP bias based on trading range clustering:
👉 Estimated 24-Hour VWAP Zone: $0.345–$0.355 USDT
Interpretation:
- Price above VWAP Zone: Short-term buyers have control intraday.
- Price near VWAP Zone: Balance between buyers and sellers — neutral intraday bias.
- Price below VWAP Zone: Short-term bearish bias.
VWAP gives context to intraday sentiment and is especially useful in range markets with frequent rejections.
Sentiment Analysis
Technical Sentiment: Mixed — oscillators near neutral with no clear trend signal. (TradingView)
Market Momentum: Meme coin sectors show choppy behavior, often tracking broader crypto risk appetite.
Community Sentiment: Public interest remains average; no strong buying conviction recently.
Neutral sentiment generally aligns with sideways price movement and wide probability bands.
Probability Bands Summary
| Timeframe | Bullish Target | Neutral Range | Bearish Target |
|---|---|---|---|
| 15-Minute | $0.355–$0.365 | $0.345–$0.355 | $0.333–$0.345 |
| 30-Minute | $0.36–$0.37 | $0.348–$0.36 | $0.332–$0.345 |
| 1-Hour | $0.37–$0.38 | $0.345–$0.37 | $0.33–$0.345 |
| 4-Hour | $0.375–$0.39 | $0.34–$0.375 | $0.32–$0.34 |
| Daily | $0.39–$0.40 | $0.33–$0.39 | $0.30–$0.33 |
| Weekly | $0.40–$0.45 | $0.32–$0.40 | $0.29–$0.32 |
| Monthly | $0.45–$0.55 | $0.31–$0.45 | $0.28–$0.31 |
Probability bands reflect directional expectation, not guaranteed outcomes.
Educational Disclaimer
This content is educational and informational only. It is not financial, investment, trading, or tax advice. Conduct your own research and consult qualified professionals before making market decisions.
Please Follow & Subscribe To One Web One Hub
2026 Jan 19 FARTCOINUSDT FI
At One Web One Hub, we deliver daily crypto probability analyses that combine live price data, multi-timeframe insights, VWAP approximations, demand/supply dynamics, sentiment context, and structural interpretation — all designed to help you interpret volatile markets with clarity.
Bookmark the blog, share with your community, and return daily for fresh, actionable perspectives that empower smarter trading decisions.
One Web One Hub — your hub for crypto clarity in chaotic markets.
Sources: Latest live price info from TradingView & aggregated feeds. (TradingView)
Previous Post FARTCOINUSDT – Probability Analysis for January 18, 2026
Next Post FARTCOINUSDT – Probability Analysis for January 20, 2026


