XRPUSDT – Probability Analysis for May 17, 2026
XRPUSDT Price Analysis – May 17, 2026
Live Market Overview
Based on the latest XRPUSDT market data from TradingView and CoinMarketCap:
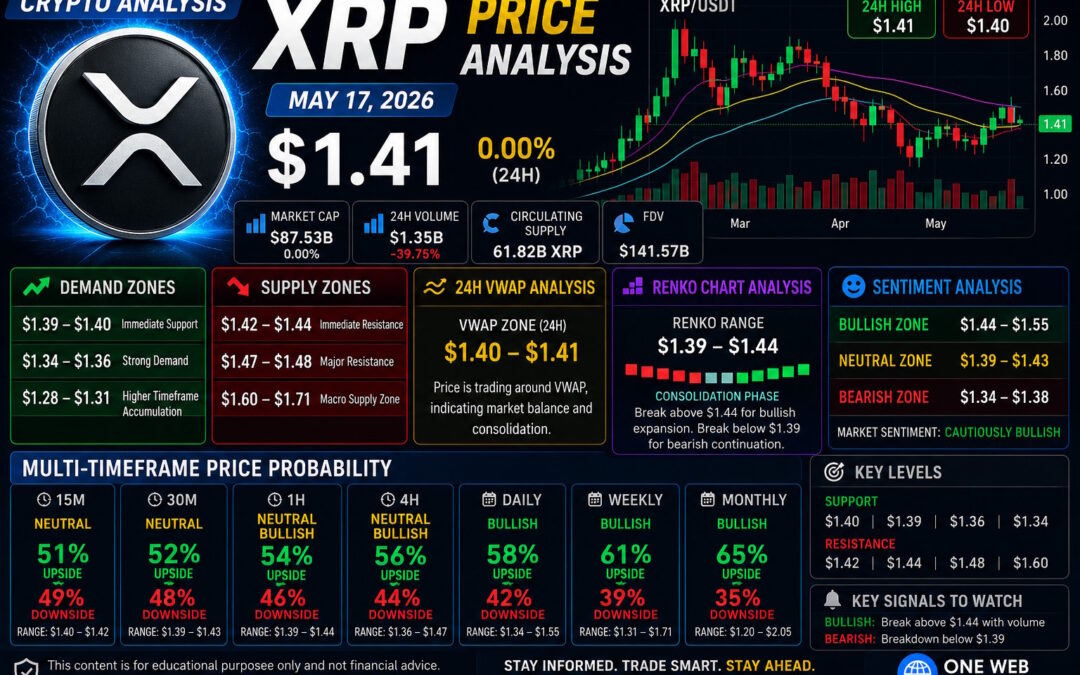
- Current XRP Price: $1.41
- 24H Change: 0.00%
- Intraday High: $1.41
- Intraday Low: $1.40
- Market Cap: ~$87.53B
- 24H Volume: ~$1.35B
- RSI: 49.46
- Stochastic RSI: 15.94 / 36.53
- Bollinger Band Range: $1.34 – $1.48
XRP is currently trading in a tight consolidation range, showing reduced volatility after recent bullish attempts failed to sustain above resistance.
Current Market Structure
Short-Term Trend
- XRP is consolidating around the $1.41 level.
- Price is moving sideways near major moving averages.
- Buyers continue defending the $1.40 support region.
Current short-term structure is neutral with slight bullish recovery potential.
Higher Timeframe Context
- Weekly structure remains constructive above $1.34.
- XRP remains below macro resistance at $1.48.
- Momentum compression suggests a larger move may develop soon.
The broader structure remains neutral-bullish while price holds above key support.
Demand and Supply Zones
Major Demand Zones
$1.39 – $1.40
Immediate buyer defense area.
$1.34 – $1.36
Strong short-term accumulation zone.
$1.28 – $1.31
Higher timeframe demand support.
Major Supply Zones
$1.42 – $1.44
Immediate resistance cluster.
$1.47 – $1.48
Critical breakout barrier.
$1.60 – $1.71
Higher timeframe macro supply zone.
Support and Resistance Levels
Key Support Levels
- $1.40
- $1.39
- $1.36
- $1.34
Key Resistance Levels
- $1.42
- $1.44
- $1.48
- $1.60
A confirmed breakout above $1.48 could trigger stronger bullish continuation.
24-Hour VWAP Analysis
Estimated 24H VWAP Zone
$1.40 – $1.41
VWAP Interpretation
- Price above VWAP = bullish intraday control
- Price below VWAP = bearish intraday pressure
- Price near VWAP = consolidation equilibrium
XRP is currently trading directly around the VWAP zone, confirming market indecision and balance between buyers and sellers.
Renko Chart Analysis
Current Renko Structure
- Alternating Renko bricks indicate range-bound movement.
- No strong directional expansion confirmed yet.
- Buyers continue defending lower support levels.
Renko Price Range
$1.39 – $1.44
Key Renko Signals
Bullish breakout confirmation:
Above $1.44
Bearish continuation confirmation:
Below $1.39
Renko analysis currently supports a consolidation phase before the next expansion move.
Multi-Timeframe Price Probability Analysis
The following probabilities are derived using:
- Price action structure
- RSI momentum
- Stochastic RSI behavior
- VWAP positioning
- Volume profile
- Renko trend structure
- Historical reaction zones
15-Minute Timeframe
Bias: Neutral
- Upside Probability: 51%
- Downside Probability: 49%
Expected Range: $1.40 – $1.42
30-Minute Timeframe
Bias: Neutral
- Upside Probability: 52%
- Downside Probability: 48%
Expected Range: $1.39 – $1.43
1-Hour Timeframe
Bias: Neutral-Bullish
- Upside Probability: 54%
- Downside Probability: 46%
Expected Range: $1.39 – $1.44
4-Hour Timeframe
Bias: Neutral-Bullish
- Upside Probability: 56%
- Downside Probability: 44%
Expected Range: $1.36 – $1.47
Daily Timeframe
Bias: Bullish
- Upside Probability: 58%
- Downside Probability: 42%
Expected Range: $1.34 – $1.55
Weekly Timeframe
Bias: Bullish
- Upside Probability: 61%
- Downside Probability: 39%
Expected Range: $1.31 – $1.71
Monthly Timeframe
Bias: Bullish
- Upside Probability: 65%
- Downside Probability: 35%
Expected Range: $1.20 – $2.05
Sentiment Analysis
Current Market Sentiment
The current XRP sentiment is cautiously bullish because:
- Major support zones continue holding.
- Buyers are defending VWAP equilibrium.
- Long-term structure remains intact.
- Selling pressure has weakened compared to previous sessions.
Sentiment Price Ranges
Bullish Sentiment Zone:
$1.44 – $1.55
Neutral Sentiment Zone:
$1.39 – $1.43
Bearish Sentiment Zone:
$1.34 – $1.38
Market participants are currently waiting for a breakout confirmation before increasing directional exposure.
Basis of Probability Calculations
This analysis framework combines several technical models:
Price Action Analysis
Support, resistance, and trend continuation.
Volume Profile
Liquidity concentration and participation levels.
Momentum Indicators
RSI and Stochastic RSI trend strength.
VWAP Positioning
Institutional trading bias estimation.
Renko Structure
Noise-filtered trend confirmation.
Historical Market Reactions
Repeated behavioral patterns at key levels.
The probabilities represent scenario likelihoods, not guaranteed outcomes.
Key Signals Traders Should Watch
Bullish Signals
- Break above $1.44
- Sustained hold above VWAP
- Rising buying volume
- RSI moving above 55
Bearish Signals
- Breakdown below $1.39
- Weak volume during rallies
- Rejection from $1.44 resistance
Continue Learning With One Web One Hub
17 May 2026 XRPUSDT FI (Referral Link)
At One Web One Hub, we simplify crypto market analysis for traders who want structured, educational, and actionable insights.
Readers regularly benefit from:
- XRP market breakdowns
- Multi-timeframe trading analysis
- Smart money concepts
- Technical analysis education
- Beginner-friendly crypto learning
- Market psychology insights
Whether you are a beginner or an experienced trader, One Web One Hub helps you better understand market behavior and improve trading discipline.
Stay connected with One Web One Hub for more XRP and crypto market insights.
Educational Disclaimer
This content is for educational and informational purposes only and does not constitute financial advice.
Cryptocurrency trading involves substantial risk and volatility. Always conduct your own research and consult a licensed financial advisor before making investment decisions.
Previous Post XRPUSDT – Probability Analysis for May 10, 2026
Next Post XRPUSDT – Probability Analysis for May 24, 2026


