XRPUSDT – Probability Analysis for May 10, 2026
XRPUSDT Price Analysis – May 10, 2026
Live Market Overview
According to the latest XRPUSDT market data from TradingView and CoinMarketCap:
-
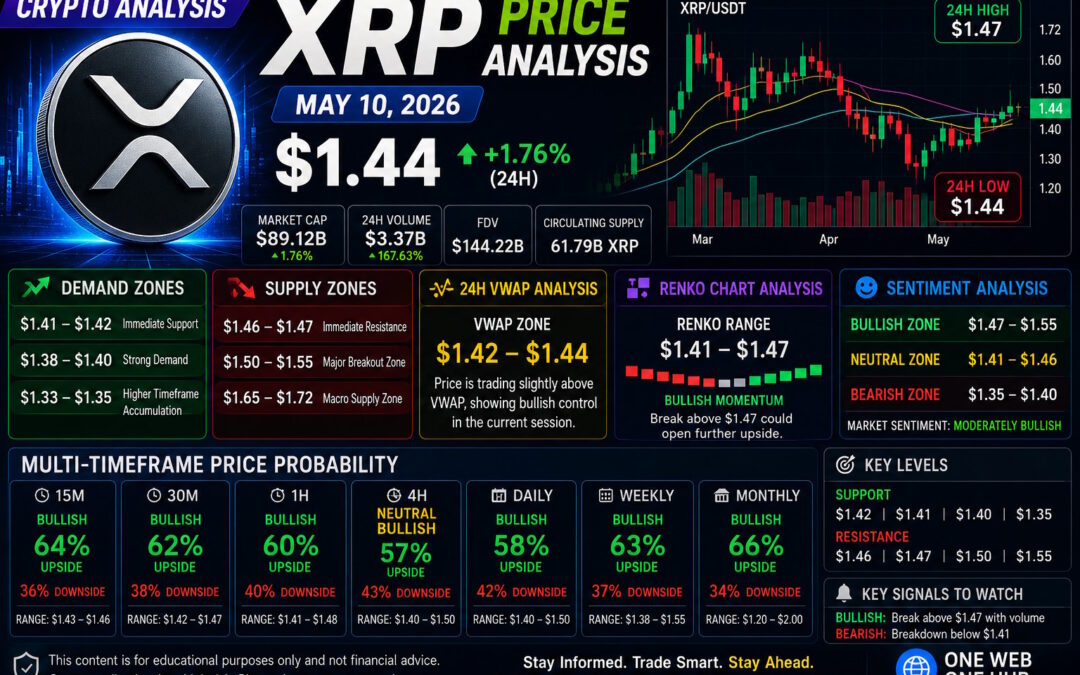
Current XRP Price: $1.44
-
24H Change: +1.76%
-
Intraday High: $1.47
-
Intraday Low: $1.44
-
Market Cap: ~$89.12B
-
24H Volume: ~$3.37B
-
RSI: 56.31
-
Stochastic RSI: Bullish momentum above 78
XRP is currently showing strong bullish momentum, supported by rising volume and sustained trading above major short-term moving averages.
Current Market Structure
Short-Term Trend
-
Buyers successfully defended the $1.41 support zone.
-
Price pushed toward $1.47 resistance with increasing momentum.
-
Volume expansion confirms active market participation.
The short-term structure is currently bullish.
Higher Timeframe Context
-
XRP reclaimed key moving averages.
-
Weekly structure remains constructive above $1.35.
-
Macro resistance remains near $1.72.
The broader market structure is neutral-bullish with breakout potential.
Demand and Supply Zones
Major Demand Zones
$1.41 – $1.42
Immediate short-term support.
$1.38 – $1.40
Strong intraday accumulation area.
$1.33 – $1.35
Higher timeframe demand zone.
Major Supply Zones
$1.46 – $1.47
Immediate resistance cluster.
$1.50 – $1.55
Major breakout zone.
$1.65 – $1.72
Macro supply area.
Support and Resistance Levels
Key Support Levels
-
$1.42
-
$1.41
-
$1.40
-
$1.35
Key Resistance Levels
-
$1.46
-
$1.47
-
$1.50
-
$1.55
A sustained move above $1.47 may trigger accelerated upside momentum.
24-Hour VWAP Analysis
Estimated VWAP Zone
$1.42 – $1.44
Interpretation
-
Price above VWAP = bullish control
-
Price below VWAP = bearish pressure
-
Price near VWAP = balanced market
Current XRP price is trading slightly above the estimated VWAP zone, confirming buyer dominance in the current session.
Renko Chart Analysis
Current Renko Structure
-
Consecutive green Renko bricks visible.
-
Momentum continuation pattern forming.
-
Pullbacks are being absorbed quickly.
Renko Price Range
$1.41 – $1.47
Key Renko Signals
Bullish breakout trigger:
Above $1.47
Bearish reversal trigger:
Below $1.41
Renko structure currently supports continuation toward higher resistance zones.
Multi-Timeframe Price Probability Analysis
The following probabilities are based on:
-
Price structure
-
Momentum indicators
-
VWAP positioning
-
Volume profile
-
Renko direction
-
Support/resistance interaction
15-Minute Timeframe
Bias: Bullish
-
Upside Probability: 64%
-
Downside Probability: 36%
Expected Range: $1.43 – $1.46
30-Minute Timeframe
Bias: Bullish
-
Upside Probability: 62%
-
Downside Probability: 38%
Expected Range: $1.42 – $1.47
1-Hour Timeframe
Bias: Bullish
-
Upside Probability: 60%
-
Downside Probability: 40%
Expected Range: $1.41 – $1.48
4-Hour Timeframe
Bias: Neutral-Bullish
-
Upside Probability: 57%
-
Downside Probability: 43%
Expected Range: $1.40 – $1.50
Daily Timeframe
Bias: Bullish
-
Upside Probability: 58%
-
Downside Probability: 42%
Expected Range: $1.38 – $1.55
Weekly Timeframe
Bias: Bullish
-
Upside Probability: 63%
-
Downside Probability: 37%
Expected Range: $1.35 – $1.72
Monthly Timeframe
Bias: Bullish
-
Upside Probability: 66%
-
Downside Probability: 34%
Expected Range: $1.20 – $2.00
Sentiment Analysis
Market Sentiment Overview
Current XRP market sentiment is moderately bullish because:
-
Volume increased significantly.
-
Buyers defended major supports.
-
Momentum indicators remain positive.
-
Market participation is strengthening.
Sentiment Price Ranges
Bullish Zone:
$1.47 – $1.55
Neutral Zone:
$1.41 – $1.46
Bearish Zone:
$1.35 – $1.40
Current sentiment favors continuation higher unless major resistance rejects price aggressively.
Basis of Probability Calculations
This analysis combines multiple technical frameworks:
Market Structure
Trend continuation and breakout behavior.
Momentum Indicators
RSI and Stochastic RSI positioning.
Volume Analysis
Liquidity and participation strength.
VWAP Positioning
Institutional intraday bias.
Renko Confirmation
Noise-free trend validation.
Historical Price Reactions
Repeated support and resistance responses.
These factors create probability-based scenarios instead of guaranteed outcomes.
Key Signals to Watch
Bullish Signals
-
Break above $1.47
-
Sustained hold above VWAP
-
Rising volume continuation
Bearish Signals
-
Rejection from $1.46 – $1.47
-
Breakdown below $1.41
-
Declining buying volume
Continue Learning With One Web One Hub
10 May 2026 XRPUSDT FI (Referral Link)
At One Web One Hub, we focus on helping traders understand the market with structured and educational crypto analysis.
Readers benefit from:
-
Daily XRP technical breakdowns
-
Smart money concepts
-
Multi-timeframe analysis
-
Trading psychology insights
-
Beginner-friendly crypto education
Our goal is simple:
Help traders make smarter decisions through knowledge and market structure understanding.
Stay connected with One Web One Hub for more professional crypto market insights.
Educational Disclaimer
This content is for educational and informational purposes only and does not constitute financial advice.
Cryptocurrency markets are highly volatile and involve risk. Always conduct your own research and consult a licensed financial professional before making investment decisions.
Previous Post XRPUSDT – Probability Analysis for May 03, 2026
Next Post XRPUSDT – Probability Analysis for May 17, 2026


