BITCOINUSDT – Probability Analysis for Jun 19, 2026
Bitcoin (BTCUSDT) Price Prediction & Technical Analysis – June 19, 2026
Bitcoin Holds Above Key Support as Bulls Defend Momentum
Bitcoin (BTC) continues to demonstrate resilience as it trades around the $63,100 region despite increasing profit-taking from short-term traders. Following several weeks of strong recovery, the world’s largest cryptocurrency remains above major moving averages, indicating that institutional demand is still supporting the broader bullish structure.
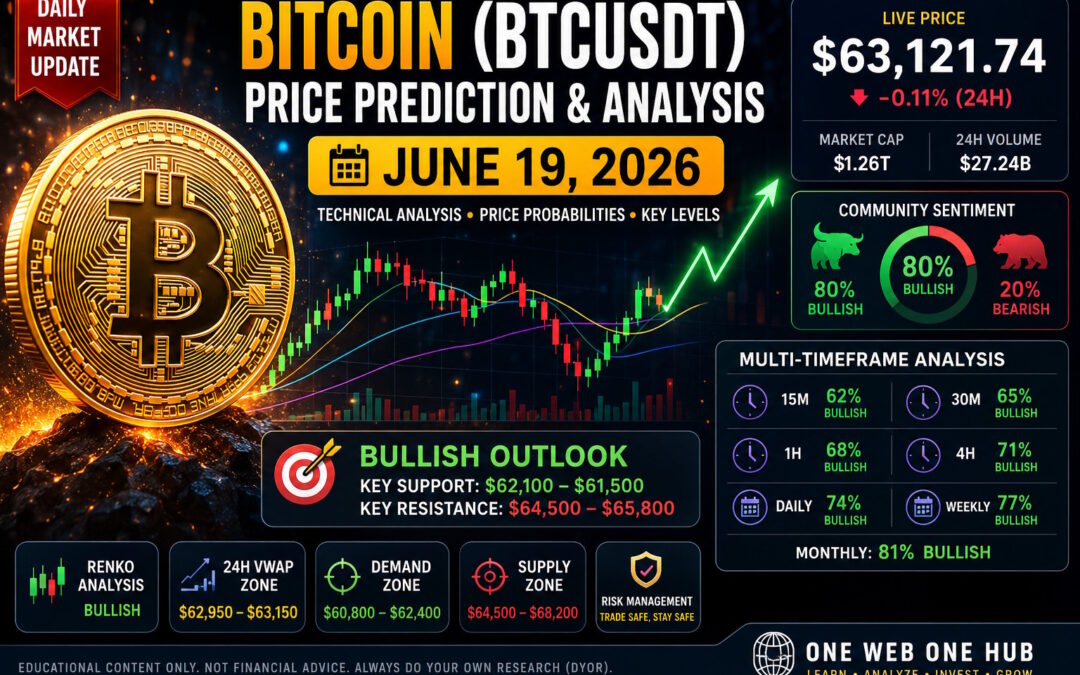
At the time of writing, Bitcoin is trading near $63,121, with a market capitalization exceeding $1.26 trillion. The 24-hour trading volume remains healthy at approximately $27 billion, suggesting that liquidity remains sufficient for continued volatility throughout the coming trading sessions.
The cryptocurrency market has entered an interesting phase where buyers continue defending major support while sellers become increasingly active near resistance zones. This environment creates excellent opportunities for both swing traders and long-term investors willing to follow disciplined risk management.
Current Market Snapshot
Live Price Overview
- Asset: Bitcoin (BTCUSDT)
- Current Price: Approximately $63,121
- 24-Hour Change: -0.11%
- Market Cap: Approximately $1.26 Trillion
- 24H Volume: Approximately $27.24 Billion
- Community Sentiment: 80% Bullish
- Overall Market Bias: Moderately Bullish
Despite a relatively flat 24-hour performance, Bitcoin continues to maintain a strong higher-timeframe uptrend.
Why Bitcoin Continues to Attract Institutional Investors
Supply Remains Limited
Bitcoin’s fixed maximum supply of 21 million coins continues to make it one of the most scarce digital assets in existence. Every market cycle further demonstrates how scarcity contributes to long-term price appreciation.
Institutional Participation
Large investment funds continue to accumulate Bitcoin during market pullbacks, creating significant demand zones that often prevent deeper corrections.
Growing Adoption
Increasing global adoption, ETF participation, and corporate treasury holdings continue supporting Bitcoin’s long-term bullish narrative.
Technical Overview
Trend Analysis
Current Trend: Bullish
Momentum Strength: Moderate
Volatility: Increasing
Market Structure: Higher Highs and Higher Lows
Bitcoin remains comfortably above major long-term moving averages while consolidating beneath recent resistance.
15-Minute BTCUSDT Price Probability Analysis
Short-Term Outlook
Current Bias: Bullish Consolidation
Probability of Bullish Continuation: 62%
Probability of Sideways Movement: 25%
Probability of Bearish Pullback: 13%
Expected Trading Range
Support
$62,850–$62,950
Resistance
$63,350–$63,500
Expected Scenario
Buyers continue defending intraday support while attempting another breakout toward the $63,500 region. Momentum indicators suggest that dips are currently being accumulated rather than aggressively sold.
30-Minute BTCUSDT Analysis
Momentum Assessment
Probability of Bullish Breakout: 65%
Probability of Range Trading: 23%
Probability of Downside Correction: 12%
Projected Range
Support Zone
$62,700–$62,900
Resistance Zone
$63,600–$63,900
Technical Observations
The 30-minute chart continues showing healthy consolidation after a recent upward impulse. Volume remains relatively balanced, indicating buyers have not yet lost control.
1-Hour Bitcoin Analysis
Intermediate Trend
Probability of Bullish Continuation: 68%
Probability of Consolidation: 20%
Probability of Bearish Move: 12%
Price Targets
Bullish Target
$64,200
Extended Bullish Target
$64,800
Bearish Support
$62,300
Critical Support
$61,900
RSI Analysis
The Relative Strength Index remains within neutral-to-bullish territory, indicating additional upside remains possible before entering overbought conditions.
Bollinger Band Analysis
Price is trading around the upper-middle portion of the Bollinger Bands, suggesting healthy momentum without excessive overheating.
Moving Average Analysis
Short-term moving averages remain positively aligned above longer-term averages, reinforcing the current bullish trend.
Market Psychology
Bulls
Buyers remain confident due to:
- Strong institutional accumulation
- Positive long-term market structure
- Healthy trading volume
- Continued ETF demand
Bears
Sellers remain focused on:
- Profit-taking near resistance
- Macro-economic uncertainty
- Short-term overbought conditions
Currently, bullish conviction appears stronger than bearish pressure.
Key Support Levels
Immediate Support
$62,900
Secondary Support
$62,300
Major Demand Zone
$61,500–$61,900
If these levels continue holding, Bitcoin maintains its bullish market structure.
Immediate Resistance Levels
Resistance 1
$63,500
Resistance 2
$64,000
Major Resistance
$64,800–$65,200
A decisive break above these areas could trigger another wave of institutional buying.
Trading Strategy for Conservative Investors
Rather than chasing strong green candles, conservative traders may prefer waiting for pullbacks toward support before entering positions. This strategy reduces emotional decision-making while improving overall risk-reward ratios.
Investors should always use stop-loss orders and position sizing that align with their individual risk tolerance.
4-Hour BTCUSDT Price Probability Analysis
Medium-Term Trend Outlook
The 4-hour timeframe continues to favor buyers despite recent consolidation. Bitcoin remains above its major dynamic support levels, indicating that the broader bullish trend is intact. Healthy pullbacks continue attracting buyers rather than triggering panic selling.
Probability Assessment
Bullish Continuation: 71%
Sideways Consolidation: 18%
Bearish Correction: 11%
Expected Trading Range
Immediate Support
$62,100–$62,500
Primary Resistance
$64,500–$64,900
Bullish Extension
$65,800
Failure below $62,100 would weaken short-term momentum, while a decisive close above $64,900 would likely invite additional buying pressure.
Daily BTCUSDT Price Probability Analysis
Daily Trend
The daily chart continues to print higher highs and higher lows, confirming that buyers remain in control of the larger market structure.
Current Market Bias: Bullish
Probability Analysis
Bullish Trend Continuation: 74%
Sideways Consolidation: 17%
Bearish Reversal: 9%
Daily Price Targets
Bullish Objective
$66,000
Extended Target
$68,500
Primary Support
$61,500
Major Demand Zone
$60,000–$60,800
As long as Bitcoin remains above the $60,000 psychological level, the broader trend remains constructive.
Weekly BTCUSDT Analysis
Macro Structure
The weekly timeframe continues to support a long-term accumulation cycle. Institutional participation and improving market sentiment continue to provide strong underlying support.
Weekly Probability
Bullish Continuation: 77%
Extended Consolidation: 15%
Bearish Correction: 8%
Weekly Trading Range
Support
$59,500–$60,500
Resistance
$68,000–$70,000
A successful breakout above the weekly resistance zone could initiate the next major expansion phase.
Monthly BTCUSDT Analysis
Long-Term Investment Perspective
Bitcoin continues respecting its historical long-term uptrend. Every significant correction has historically provided accumulation opportunities for long-term investors.
Monthly Probability
Bullish Continuation: 81%
Sideways Market: 12%
Bearish Macro Correction: 7%
Long-Term Price Targets
Conservative Target
$72,000
Moderate Bullish Target
$78,000
Aggressive Bullish Target
$85,000
Major Long-Term Support
$55,000–$58,000
Renko Chart Analysis
Renko Trend Assessment
Although a native Renko chart is not directly available, price action strongly suggests that Renko bricks would currently remain positive, reflecting sustained bullish momentum.
Estimated Renko Brick Direction
Current Trend
Bullish
Estimated Brick Size
$400–$600
Bullish Continuation Range
$63,500–$65,000
Bearish Reversal Confirmation
Below $61,800
Renko Interpretation
The absence of multiple bearish reversal signals suggests that buyers continue absorbing selling pressure effectively. A continuation of higher Renko bricks would reinforce the probability of another upward impulse.
Demand Zones
Primary Institutional Demand
$60,800–$61,500
This area has repeatedly attracted buyers during previous pullbacks.
Secondary Demand
$62,000–$62,400
Short-term traders are expected to defend this region aggressively.
Extreme Demand
$58,500–$59,500
Long-term investors may view this area as a high-value accumulation zone if reached.
Supply Zones
Initial Supply
$64,500–$65,000
Some profit-taking activity is expected here.
Major Supply
$66,800–$68,200
Institutional sellers may become increasingly active if Bitcoin rallies into this zone.
Extreme Supply
Above $70,000
Historically, psychological round numbers attract increased volatility and distribution.
Support Levels
Immediate Support
$62,900
Strong Support
$62,100
Major Support
$61,500
Critical Long-Term Support
$60,000
Resistance Levels
Immediate Resistance
$63,500
Secondary Resistance
$64,500
Major Resistance
$65,800
Long-Term Resistance
$68,000
Estimated 24-Hour VWAP Analysis
Estimated VWAP Zone
Estimated 24H VWAP
Approximately $62,950–$63,150
Current Price Position
Trading slightly above the estimated VWAP zone suggests buyers maintain short-term control.
VWAP Interpretation
Price Remaining Above VWAP
Bullish
Price Returning Toward VWAP
Healthy Pullback
Price Falling Below VWAP
Short-Term Weakness
Institutional traders often monitor VWAP as a measure of fair market value. Remaining above this zone generally favors continued buying interest.
Market Sentiment Analysis
Overall Sentiment
Market Mood: Moderately Bullish
Community Sentiment: 80% Bullish
Fear Level: Low
Greed Level: Moderate
Institutional Sentiment
Institutional investors continue displaying confidence through consistent accumulation during periods of market weakness rather than chasing momentum at higher prices.
Retail Sentiment
Retail participation continues increasing as Bitcoin stabilizes above major support, although some traders remain cautious after recent volatility.
Basis of Probability Analysis
The probabilities presented throughout this analysis are derived from a combination of technical factors rather than relying on any single indicator.
These include:
- Price action and market structure
- Support and resistance confluence
- Relative Strength Index (RSI)
- Bollinger Band positioning
- Moving Average alignment
- Trading volume trends
- Market sentiment indicators
- Historical Bitcoin volatility
- Trend continuation statistics
- Multi-timeframe confirmation
- Risk-reward assessment
Combining multiple technical tools helps reduce reliance on individual indicators and provides a more balanced view of potential market outcomes.
Final Thoughts
Bitcoin continues to demonstrate remarkable resilience despite periods of short-term volatility. The current market structure favors buyers across nearly every timeframe, supported by strong institutional participation, healthy trading volume, and an overall bullish technical landscape.
While minor pullbacks should always be expected in any healthy market, the broader trend continues pointing toward higher price levels as long as Bitcoin maintains support above the critical $60,000–$61,500 region.
Short-term traders should remain patient and avoid emotional entries during periods of heightened volatility. Instead, waiting for confirmations around major support and resistance levels may provide higher-probability trading opportunities.
Long-term investors, meanwhile, should continue focusing on Bitcoin’s broader adoption narrative, increasing institutional demand, and historically strong performance over extended investment horizons.
As always, proper risk management remains the cornerstone of successful trading. Never risk more capital than you can comfortably afford to lose, and always use stop-loss strategies appropriate for your trading style.
Trading Plan Summary
Intraday Traders
Bias: Bullish
Preferred Buy Zone
$62,850–$63,050
Profit Targets
- Target 1: $63,500
- Target 2: $64,000
- Target 3: $64,800
Protective Stop
Below $62,300
Swing Traders
Bias: Bullish
Accumulation Zone
$61,500–$62,300
Medium-Term Targets
- $66,000
- $68,500
- $72,000
Invalidation Level
Daily close below $60,000
Long-Term Investors
The monthly structure remains constructive, with Bitcoin continuing to establish higher highs and higher lows. Investors with a long-term horizon may continue to view pullbacks toward major demand zones as potential accumulation opportunities rather than reasons for panic.
Key Takeaways
Bullish Factors
- Price remains above major support levels.
- Higher highs and higher lows continue across larger timeframes.
- Strong community sentiment remains overwhelmingly bullish.
- Institutional participation continues supporting the market.
- Trading volume remains healthy.
- Estimated VWAP positioning favors buyers.
- Multi-timeframe momentum continues supporting upside scenarios.
Risk Factors
- Profit-taking near major resistance levels.
- Unexpected macroeconomic news.
- Increased market volatility.
- False breakouts around psychological price levels.
- Temporary liquidity hunts before trend continuation.
Frequently Asked Questions
Is Bitcoin Still Bullish?
Based on the current technical structure, Bitcoin continues to maintain a bullish outlook across most major timeframes. However, traders should continue monitoring support levels for any signs of structural weakness.
Is This a Good Time to Buy Bitcoin?
Rather than chasing price rallies, many experienced traders prefer accumulating during controlled pullbacks into strong demand zones while following strict risk management principles.
What Are the Most Important Levels to Watch?
Support
- $62,900
- $62,100
- $61,500
- $60,000
Resistance
- $63,500
- $64,500
- $65,800
- $68,000
These price levels are expected to play a significant role in determining Bitcoin’s next major directional move.
Disclaimer
This article is intended solely for educational and informational purposes. Cryptocurrency markets are highly volatile and involve substantial risk. The technical analysis, probability estimates, price projections, Renko assessments, VWAP estimates, support and resistance zones, demand and supply areas, and sentiment analysis presented in this article represent analytical opinions based on available market information and should not be interpreted as financial, investment, tax, or legal advice.
Always conduct your own independent research (DYOR), verify market conditions through multiple reliable sources, and consult a qualified financial advisor before making any investment decisions. Past performance does not guarantee future results, and no analysis can predict market movements with certainty.
Continue Your Crypto Journey with One Web One Hub

19 Jun 2026 BITCOINUSDT (Referral Link)
At One Web One Hub, our mission is to simplify cryptocurrency investing through comprehensive, research-driven educational content. Whether you’re a beginner taking your first steps into digital assets or an experienced trader refining your strategy, our platform delivers timely insights designed to help you navigate the ever-changing crypto landscape.
Here’s what you’ll find on One Web One Hub:
Daily Cryptocurrency Market Analysis
Stay informed with fresh technical analysis covering Bitcoin, Ethereum, Solana, XRP, Cardano, Cosmos, Fartcoin, and many other leading cryptocurrencies. Each report includes multi-timeframe analysis, support and resistance levels, market sentiment, and probability-based outlooks.
Educational Trading Guides
Expand your knowledge with easy-to-follow guides on technical indicators, candlestick patterns, risk management, portfolio diversification, blockchain technology, decentralized finance (DeFi), and more.
Investment and Tax Resources
Explore practical articles covering cryptocurrency taxation, bookkeeping, financial reporting, investment strategies, and regulatory updates to help you make informed financial decisions.
Market News and Emerging Trends
Keep up with the latest developments in blockchain innovation, institutional adoption, ETFs, regulations, and emerging Web3 technologies shaping the future of digital finance.
Join Our Growing Community
If you found this Bitcoin analysis helpful:
- Bookmark One Web One Hub for daily market updates.
- Share this article with fellow crypto enthusiasts.
- Explore our expanding library of educational resources.
- Subscribe for future market insights and trading education.
- Follow our latest posts to stay ahead of market trends.
Knowledge is one of the most valuable assets in investing. By staying informed and continuously learning, you’ll be better equipped to navigate market volatility and make disciplined investment decisions.
Thank you for reading, and we look forward to helping you on your cryptocurrency journey with more in-depth market analysis and educational content every day.
Previous Post BITCOINUSDT – Probability Analysis for Jun 12, 2026


