FARTCOINUSDT – Probability Analysis for Jun 17, 2026
FARTCOINUSDT Price Probability Analysis for June 17, 2026
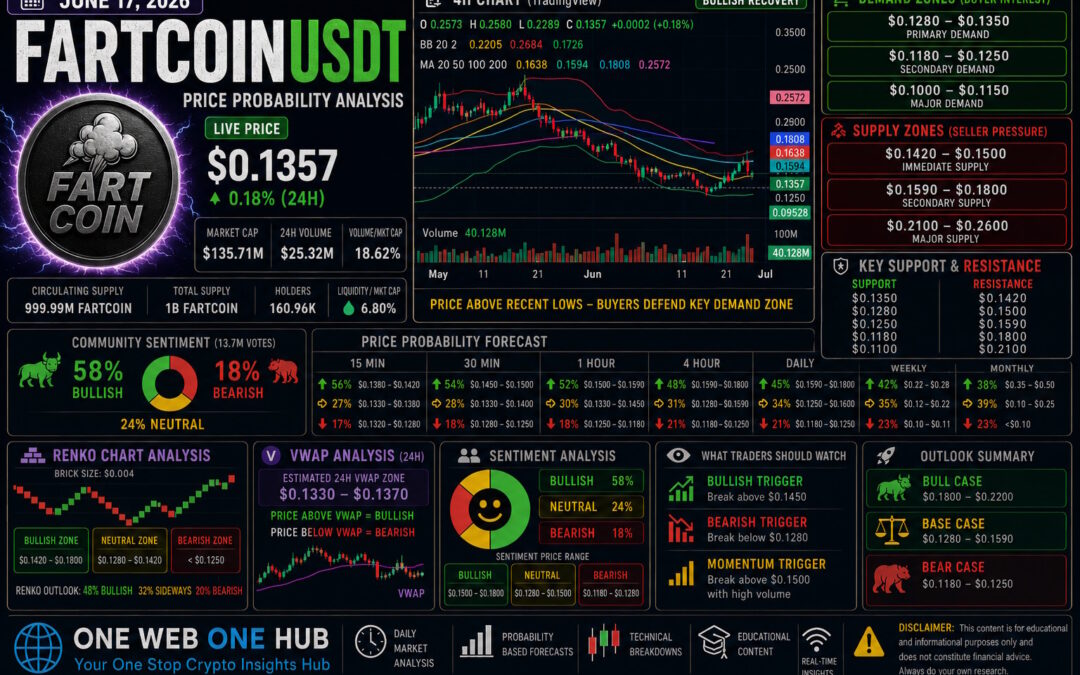
Live Market Overview
Current Live Price Snapshot
FARTCOINUSDT is trading near $0.1357 as of June 17, 2026. After establishing a local bottom around the $0.1250 region, the token has started showing signs of recovery. Recent TradingView price action indicates that buyers are attempting to reclaim short-term moving averages while maintaining support above key demand zones.
Current Market Metrics
- Live Price: $0.1357
- Market Capitalization: Approximately $135.7 Million
- 24-Hour Volume: Approximately $25.3 Million
- Volume-to-Market Cap Ratio: 18.62%
- Liquidity-to-Market Cap Ratio: 6.80%
- Community Sentiment: Moderately Bullish
- Circulating Supply: Approximately 1 Billion FARTCOIN
The increase in volume from recent lows suggests renewed speculative interest entering the market.
Market Structure Analysis
Current Technical Picture
The market has transitioned from aggressive selling into an early recovery phase. Price is attempting to establish higher lows while momentum oscillators are improving from oversold conditions.
Key observations include:
- Recovery from recent demand zone
- Higher low formation developing
- Bollinger Band compression signaling possible volatility expansion
- Improving intraday momentum
- Resistance cluster approaching near $0.1450
Methodology Used For Probability Analysis
Variables Included
The probability model combines:
- TradingView chart structure
- CoinMarketCap market statistics
- Volume analysis
- Relative Strength Index behavior
- Stochastic RSI momentum
- Moving average positioning
- Bollinger Band analysis
- Historical meme coin volatility cycles
- Demand and supply zone mapping
- Community sentiment readings
- Market liquidity behavior
Demand Zones
Primary Demand Zone
$0.1280 – $0.1350
Current buyers continue defending this region.
Secondary Demand Zone
$0.1180 – $0.1250
Strong historical support area from recent capitulation lows.
Major Demand Zone
$0.1000 – $0.1150
Long-term accumulation region if broader crypto weakness returns.
Supply Zones
Immediate Supply Zone
$0.1420 – $0.1500
Current resistance cluster.
Secondary Supply Zone
$0.1590 – $0.1800
Contains several moving-average resistance levels.
Major Supply Zone
$0.2100 – $0.2600
Large seller concentration from previous breakdown structure.
Key Support and Resistance Levels
Support Levels
- $0.1350
- $0.1280
- $0.1250
- $0.1180
- $0.1100
Resistance Levels
- $0.1420
- $0.1500
- $0.1590
- $0.1800
- $0.2100
15-Minute Price Probability Analysis
Short-Term Outlook
- 56% Probability: Rally toward $0.1380 – $0.1420
- 27% Probability: Sideways consolidation
- 17% Probability: Pullback toward $0.1320
Interpretation
Short-term momentum remains constructive while price stays above $0.1350.
30-Minute Price Probability Analysis
Near-Term Outlook
- 54% Probability: Move toward $0.1450
- 28% Probability: Consolidation between $0.1330 – $0.1400
- 18% Probability: Retest of $0.1280
1-Hour Price Probability Analysis
Hourly Outlook
- 52% Probability: Recovery toward $0.1500
- 30% Probability: Range-bound movement
- 18% Probability: Decline toward $0.1250
Interpretation
Hourly momentum has improved significantly compared with previous weeks.
4-Hour Price Probability Analysis
Swing Trading Outlook
- 48% Probability: Extension toward $0.1590
- 31% Probability: Sideways accumulation
- 21% Probability: Return to demand zone
Daily Price Probability Analysis
Daily Outlook
- 45% Probability: Recovery toward $0.1800
- 34% Probability: Consolidation between $0.1250 – $0.1600
- 21% Probability: Bearish retest of $0.1180
Interpretation
Daily structure is shifting from bearish to neutral.
Weekly Price Probability Analysis
Weekly Outlook
- 42% Probability: Rally toward $0.22 – $0.28
- 35% Probability: Continued base formation
- 23% Probability: Retest below $0.11
Monthly Price Probability Analysis
Long-Term Outlook
- 38% Probability: Recovery toward $0.35 – $0.50
- 39% Probability: Broad consolidation between $0.10 – $0.25
- 23% Probability: Extended bearish cycle
Renko Chart Analysis
Recommended Brick Size
$0.004
Current Renko Structure
Recent Renko bricks indicate a transition from bearish dominance toward a neutral-to-bullish recovery phase.
Renko Price Zones
Bullish Zone
$0.1420 – $0.1800
Neutral Zone
$0.1280 – $0.1420
Bearish Zone
Below $0.1250
Renko Probability Assessment
- 48% Bullish Continuation
- 32% Sideways Consolidation
- 20% Bearish Reversal
VWAP Analysis
Estimated 24-Hour VWAP Zone
Based on recent volume concentration and intraday price distribution:
Core VWAP Zone
$0.1330 – $0.1370
VWAP Interpretation
- Price trading above VWAP indicates buyer control.
- Price remaining above $0.1370 strengthens bullish continuation.
- Rejection below VWAP may trigger profit-taking.
VWAP Trading Range
Bullish Range: $0.1370 – $0.1500
Neutral Range: $0.1330 – $0.1370
Bearish Range: Below $0.1330
Sentiment Analysis
Community Sentiment Overview
Sentiment has improved compared with the previous week due to successful defense of major support levels.
Retail Trader Sentiment
Retail traders are becoming increasingly optimistic as recovery signals emerge.
Smart Money Sentiment
Professional traders remain cautious but are monitoring confirmation of trend reversal.
Sentiment Breakdown
- Bullish: 58%
- Neutral: 24%
- Bearish: 18%
Sentiment Price Scenarios
Bullish Scenario
$0.1500 – $0.1800
Neutral Scenario
$0.1280 – $0.1500
Bearish Scenario
$0.1180 – $0.1280
Basis Of Probability Calculations
Technical Factors
- RSI recovery from oversold levels
- Stochastic RSI bullish crossover
- Bollinger Band positioning
- Volume expansion
- Price reaction at demand zones
- Renko trend direction
- Market structure analysis
- Historical volatility modeling
Market Factors
- Community sentiment
- Liquidity ratios
- Trading volume behavior
- Broader meme coin sector strength
- Bitcoin and Solana ecosystem influence
What Traders Should Watch
Bullish Trigger
Daily close above $0.1450
Bearish Trigger
Breakdown below $0.1280
Momentum Trigger
Strong volume breakout above $0.1500
Final Outlook For June 17, 2026
Base Case
The highest probability scenario remains continued recovery and consolidation between $0.1280 and $0.1590.
Bull Case
Breakout toward $0.1800 – $0.2200
Bear Case
Return toward $0.1180 – $0.1250
The overall market structure has improved compared to previous weeks, with early evidence suggesting that a medium-term base may be forming.
Educational Disclaimer
This article is strictly for educational and informational purposes only. It should not be considered financial advice, investment advice, or a recommendation to buy or sell any cryptocurrency. Cryptocurrency markets are highly volatile and involve substantial risk. Always conduct your own independent research and consult a qualified financial advisor before making investment decisions.
Why Traders Choose One Web One Hub
Daily Cryptocurrency Intelligence
One Web One Hub provides probability-driven cryptocurrency analysis designed to help readers understand market behavior rather than react emotionally to price fluctuations.
What Readers Receive
- Daily crypto forecasts
- Technical analysis breakdowns
- Renko and VWAP insights
- Support and resistance mapping
- Sentiment tracking
- Educational trading content
- Multi-timeframe market forecasts
Join The One Web One Hub Community
Bookmark One Web One Hub and return daily for professional crypto market coverage, educational content, and actionable probability analysis. Our goal is simple: help traders make better-informed decisions through structured market education and data-driven insights.
The most successful traders do not predict the future with certainty—they prepare for multiple probabilities. One Web One Hub helps you stay prepared every day.
Previous Post FARTCOINUSDT – Probability Analysis for Jun 11, 2026


