XRPUSDT – Probability Analysis for May 03, 2026
XRPUSDT Price Analysis – May 03, 2026
Live Market Overview
Based on the latest XRPUSDT data from TradingView and CoinMarketCap:
-
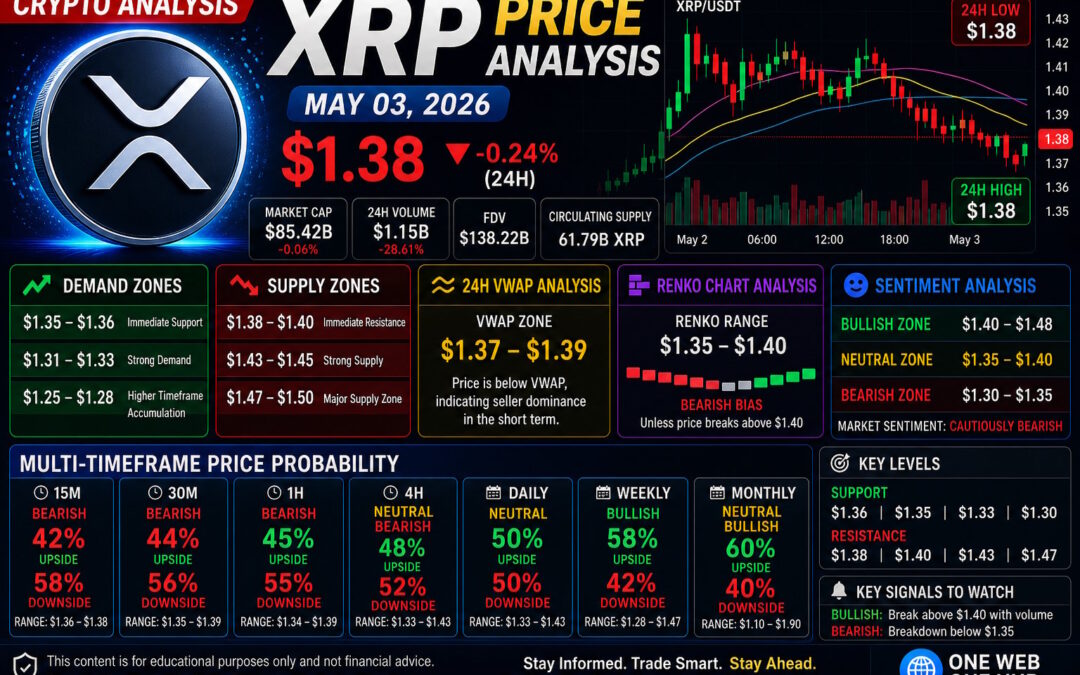
Current Price: $1.38
-
24H Change: -0.24%
-
Intraday High: $1.38
-
Intraday Low: $1.38
-
Market Cap: ~$85.42B
-
24H Volume: ~$1.15B
-
RSI (1H approx): 38 (weak momentum)
-
Stochastic RSI: Oversold region
XRP is currently showing short-term weakness, with price compressing near support and momentum indicators pointing toward potential exhaustion of selling pressure.
Current Market Structure
Short-Term Trend
-
Clear rejection from $1.39–$1.40
-
Price drifting downward with weak buying response
-
Momentum indicators turning oversold
This indicates a short-term bearish bias with potential for a relief bounce.
Higher Timeframe Context
-
XRP still holding above key structure at $1.35
-
No major breakdown yet
-
Market in range compression phase
Overall structure remains neutral with downside risk.
Demand and Supply Zones
Major Demand Zones
$1.35 – $1.36
Immediate support area where buyers may step in.
$1.31 – $1.33
Strong demand zone based on prior consolidation.
$1.25 – $1.28
Higher timeframe accumulation zone.
Major Supply Zones
$1.38 – $1.40
Immediate resistance where price is repeatedly rejected.
$1.43 – $1.45
Strong supply cluster.
$1.47 – $1.50
Major breakout zone.
Support and Resistance Levels
Key Support Levels
-
$1.36
-
$1.35
-
$1.33
-
$1.30
Key Resistance Levels
-
$1.38
-
$1.40
-
$1.43
-
$1.47
A sustained move above $1.40 is required for bullish recovery.
24-Hour VWAP Analysis
Estimated VWAP Zone
$1.37 – $1.39
Interpretation
-
Price below VWAP → bearish pressure
-
Price above VWAP → bullish strength
-
Price at VWAP → consolidation
Current XRP price is slightly below VWAP, confirming seller dominance in the short term.
Renko Chart Analysis
Current Renko Structure
-
Formation of consecutive red bricks
-
Weak bullish reversal attempts
-
No confirmed trend reversal yet
Renko Price Range
$1.35 – $1.40
Key Renko Signals
Bullish reversal trigger:
Above $1.40
Bearish continuation trigger:
Below $1.35
Renko confirms bearish continuation unless resistance breaks.
Multi-Timeframe Price Probability Analysis
Probabilities are derived using:
-
Trend direction
-
RSI/Stochastic positioning
-
Volume profile
-
VWAP alignment
-
Support/resistance interaction
-
Renko structure
15-Minute Timeframe
Bias: Bearish
-
Upside Probability: 42%
-
Downside Probability: 58%
Expected Range: $1.36 – $1.38
30-Minute Timeframe
Bias: Bearish
-
Upside Probability: 44%
-
Downside Probability: 56%
Expected Range: $1.35 – $1.39
1-Hour Timeframe
Bias: Bearish
-
Upside Probability: 45%
-
Downside Probability: 55%
Expected Range: $1.34 – $1.40
4-Hour Timeframe
Bias: Neutral-Bearish
-
Upside Probability: 48%
-
Downside Probability: 52%
Expected Range: $1.33 – $1.43
Daily Timeframe
Bias: Neutral
-
Upside Probability: 50%
-
Downside Probability: 50%
Expected Range: $1.30 – $1.47
Weekly Timeframe
Bias: Bullish
-
Upside Probability: 58%
-
Downside Probability: 42%
Expected Range: $1.28 – $1.60
Monthly Timeframe
Bias: Neutral-Bullish
-
Upside Probability: 60%
-
Downside Probability: 40%
Expected Range: $1.10 – $1.90
Sentiment Analysis
Market Sentiment Overview
-
Retail sentiment: Bearish (short-term fear)
-
Smart money: Accumulating near support zones
-
Momentum: Weak but nearing reversal conditions
Sentiment Price Ranges
Bullish Zone:
$1.40 – $1.48
Neutral Zone:
$1.35 – $1.40
Bearish Zone:
$1.30 – $1.35
Current sentiment suggests possible bounce from support if buyers step in.
Basis of Probability Calculations
This analysis is built using a confluence of:
Market Structure
Trend continuation and breakdown levels
Volume Analysis
Liquidity and participation
Momentum Indicators
RSI and Stochastic signals
VWAP Position
Institutional control zones
Renko Trends
Noise-free confirmation
Historical Price Reactions
Repeated behavior at key levels
These factors combine to create high-probability trading scenarios, not certainty.
Key Signals to Watch
Bullish Signals
-
Break above $1.40
-
Strong reclaim of VWAP
-
Volume spike with upward momentum
Bearish Signals
-
Breakdown below $1.35
-
Continued rejection at $1.38
-
Weak recovery attempts
Please Follow & Bookmark To Continue Learning With One Web One Hub
03 May 2026 XRPUSDT FI (Referral Link)
Want to stay ahead in crypto trading?
One Web One Hub is your daily destination for:
-
Real-time crypto analysis
-
XRP-focused trading insights
-
Smart money strategies
-
Multi-timeframe breakdowns
-
Beginner to advanced trading education
We don’t just show charts — we help you understand market behavior so you can trade smarter.
Make One Web One Hub your edge in the market.
Educational Disclaimer
This content is for educational and informational purposes only and does not constitute financial advice.
Cryptocurrency trading involves significant risk. Always conduct your own research and consult a licensed financial advisor before making investment decisions.
Previous Post XRPUSDT – Probability Analysis for Apr 26, 2026
Next Post XRPUSDT – Probability Analysis for May 10, 2026


