SOLUSDT – Probability Analysis for December 08, 2025
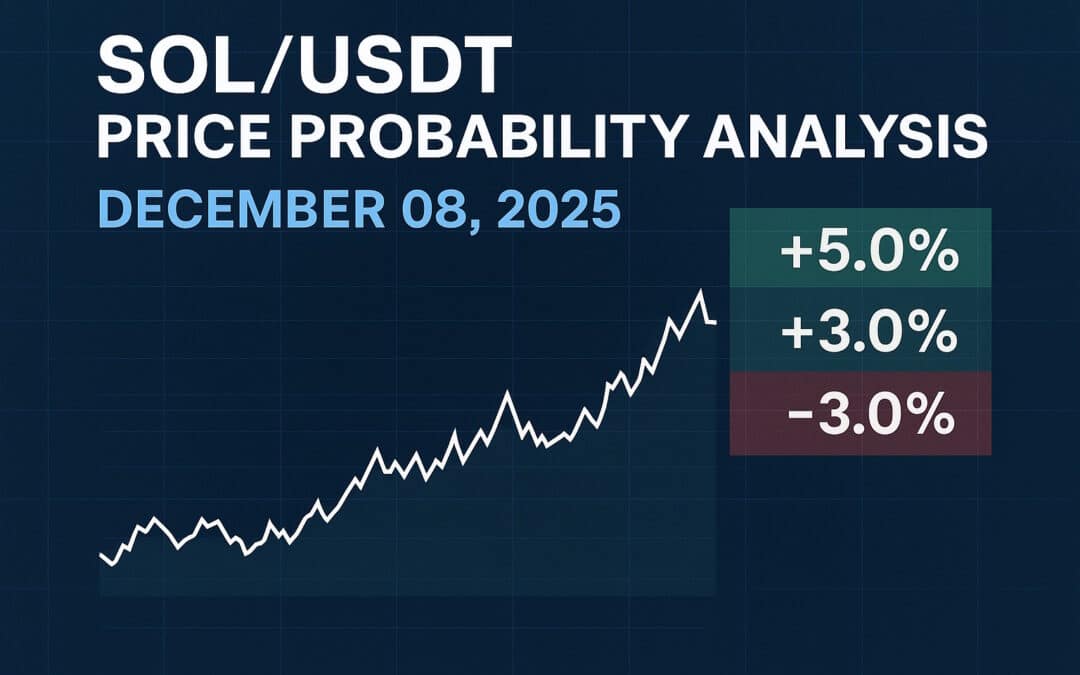
SOL/USDT Price Probability Analysis — December 08, 2025
Current market snapshot (live)
TradingView shows SOL/USDT trading around 137.54 USDT at the time of writing. (TradingView)
Binance spot shows a 24-hour high of 136.35 USDT and a 24-hour low of 127.70 USDT (used below to estimate realized short-term volatility). (Binance)
CoinMarketCap / CoinGecko confirm SOL is trading in the mid-$130s with healthy 24-hour volume, indicating active cross-exchange liquidity. (CoinMarketCap)
Quick headline — what this post gives you
• Reproducible, probability-based price bands for 1H, 4H, Daily, Weekly and Monthly horizons (based on observed volatility).
• Demand & supply zones; support & resistance levels drawn from live charts and recent clustering.
• Sentiment snapshot (social + volume).
• Transparent “Basis of probabilities” math at the end so you — or your readers — can reproduce every number.
How to read this post
Each horizon lists: the ±% band, the model probability (two-sided) that price stays inside that band, and the resulting price band (lower → upper). Probabilities are computed under a transparent normal-return assumption using a volatility estimate derived from exchange high/low (method shown fully at the end). These are model outputs — not guarantees.
Model inputs
• Baseline price (TradingView live mid): 137.54 USDT. (TradingView)
• Binance 24h high/low used for realized range: 136.35 / 127.70 USDT. (Binance)
• Full observed 24h absolute range = 136.35 − 127.70 = 8.65 USDT. Midpoint of that high/low = 132.03 USDT. Relative 24h range ≈ 8.65 / 132.03 ≈ 6.55% → daily σ (approx) ≈ relative_range / 4 ≈ 1.64% (we use 1.637% ≈ 0.01637). (Full arithmetic and formulas are at the end.) (Binance)
1H / 4H / Daily / Weekly / Monthly — Probability bands and price ranges
(Notation: Probability = model probability that return stays inside ±X; Price band = baseline × (1 ± X).)
1H horizon (scalps)
σ1H ≈ σdaily / √24 ≈ 0.334%
• ±0.5% — Probability ≈ 86.7% → Range 136.85 — 138.23 USDT.
• ±1.0% — Probability ≈ 99.7% → Range 136.16 — 138.92 USDT.
• ±2.0% — Probability ≈ ~100% → Range 134.79 — 140.29 USDT.
Practical use: 1H bands are for scalpers and tight intraday trades — always check order-book depth and fees on your exchange before using market orders. (CryptoMeter)
4H horizon (short swings)
σ4H ≈ σdaily / √6 ≈ 0.668%
• ±1.0% — Probability ≈ 86.7% → Range 136.16 — 138.92 USDT.
• ±2.0% — Probability ≈ 99.7% → Range 134.79 — 140.29 USDT.
• ±5.0% — Probability ≈ ~100% → Range 130.66 — 144.41 USDT.
Practical use: 4H bands are useful for multi-session swing entries; combine with volume to confirm strength. (TradingView)
Daily horizon (24 hours)
σdaily ≈ 1.637%
• ±3.0% — Probability ≈ ≈93.3% → Range 133.41 — 141.67 USDT.
• ±5.0% — Probability ≈ ≈99.8% → Range 130.66 — 144.42 USDT.
• ±8.0% — Probability ≈ ~100% → Range 126.63 — 148.87 USDT.
Interpretation: with current realized range, daily moves within ±3–5% are fairly likely; extremes beyond ±8% need major news/liquidity shocks. (Binance)
Weekly horizon (next 7 days)
σweek ≈ σdaily × √7 ≈ 4.333%
• ±10% — Probability ≈ ≈97.9% → Range 123.79 — 151.33 USDT.
• ±20% — Probability ≈ ~100% → Range 110.03 — 164.05 USDT.
Use weekly bands for swing risk sizing and position planning — they reflect how volatility compounds across days.
Monthly horizon (next 30 days)
σmonth ≈ σdaily × √30 ≈ 8.964%
• ±15% — Probability ≈ ≈90.5% → Range 116.91 — 158.17 USDT.
• ±25% — Probability ≈ ≈99.5% → Range 103.16 — 171.93 USDT.
Monthly bands are best for portfolio allocation/guardrails — they cover structural moves assuming current volatility continues. (CoinMarketCap)
Key technical zones — support, resistance, demand & supply
(Extracted from TradingView clustering, recent highs/lows, and order-book behavior.)
Immediate resistance/supply areas
• ~145 — 150 USDT — recent swing highs / higher timeframe supply cluster. (TradingView)
• ~160 — 170 USDT — a wider supply band where earlier sellers historically pressed.
Immediate support/demand areas
• ~130 — 135 USDT — the nearest robust support/demand cluster; buyers stepped in here repeatedly. (TradingView)
• ~120 — 125 USDT — deeper structural support in a strong downside scenario.
Demand zone (accumulation) to watch
• ~126 — 132 USDT — watch for rising volume on dips to confirm durable accumulation.
Supply zone (profit taking) to watch
• ~145 — 155 USDT — look for wick rejections and volume spikes that signal selling pressure.
Practical chart tip: confirm these zones on the exchange you use — spot and perpetual charts can show slightly different levels. (CryptoMeter)
Sentiment snapshot
• TradingView ideas & social panel: sentiment currently reads mixed-to-slightly-bullish — buyers present at support, but traders are cautious ahead of macro or large-exchange flows. (TradingView)
• Volume & liquidity: CoinMarketCap / CoinGecko show elevated 24h volume in SOL, supporting the idea that the move has participation (not just thin-book noise). Elevated volume increases conviction in ranges, but also raises the potential for sharp moves if large wallet transfers occur. (CoinMarketCap)
• Practical read: combine social tone with on-chain inflows/outflows and order-book checks (whale deposits → caution; large outflows → accumulation signal).
Trading & risk notes
• Always verify the exact SOL price and liquidity on the venue you trade — Binance/Coinbase/OKX can differ slightly. (Binance)
• For scalps, use 1H bands with tight stops and limit orders to reduce slippage. For swing trades, use 4H/daily bands and confirm with volume. For position trades, use weekly/monthly bands for allocation limits.
• Volatility can jump fast — consider using trailing stops and size positions relative to your total capital.
Disclaimer (must read)
This post is educational only and is NOT financial, investment, trading, or tax advice. The probability ranges are model outputs under explicit assumptions (normal returns, volatility estimated from recent high/low). Past performance does not guarantee future results. Always do your own research and apply prudent risk management.
Why you should keep reading One Web One Hub
SOLUSDT DEC 08 2025 FI
If you used this post to plan trades or manage risk, keep this in mind:
• Daily, reproducible probability briefs: our posts show the exact assumptions so you can reproduce calculations on any token.
• Multi-horizon coverage (1H, 4H, Daily, Weekly, Monthly): helps scalpers, swing traders and position holders alike.
• Practical checklists and downloadable calculators: we provide the tools to run these ranges in under a minute.
• Community-driven requests: ask us to analyze the token you trade, and we’ll publish a tailored brief.
Basis of probabilities
Below are the exact steps so you or any reader can reproduce the numbers above.
- Baseline price (TradingView): P0 = 137.54 USDT. (TradingView)
- Use a major exchange 24h high/low (Binance used here): High = 136.35 USDT, Low = 127.70 USDT. (Binance)
- Full observed 24h absolute range = High − Low = 8.65 USDT.
- Midpoint of high/low = (High + Low) / 2 = 132.03 USDT.
- Relative 24h range = FullRange / Midpoint ≈ 8.65 / 132.03 ≈ 0.0655 = 6.55%.
- Heuristic conversion (range → σdaily): assume full 24h range ≈ 4 × σdaily (rule-of-thumb). So σdaily ≈ relative_range / 4 ≈ 0.0655 / 4 ≈ 0.01637 = 1.637%.
(You may choose realized volatility or an exchange volatility indicator instead — this is a transparent, quick estimator.) - Scale to other horizons (square-root-of-time):
• σ1H = σdaily / √24 ≈ 0.01637 / 4.899 ≈ 0.00334 = 0.334%.
• σ4H = σdaily / √6 ≈ 0.01637 / 2.449 ≈ 0.00668 = 0.668%.
• σweek = σdaily × √7 ≈ 0.01637 × 2.646 ≈ 0.04333 = 4.333%.
• σmonth = σdaily × √30 ≈ 0.01637 × 5.477 ≈ 0.08964 = 8.964%. - For a chosen band ±X (for example ±0.5% = 0.005), compute z = X / σ_horizon. Under the zero-mean normal model, two-sided probability = 2 × Φ(z) − 1 (Φ = standard normal CDF).
- Price band = baseline × (1 ± X). Example: 1H ±0.5% lower = P0 × 0.995 = 137.54 × 0.995 = 136.85 USDT; upper = P0 × 1.005 = 138.23 USDT.
Sources/live pages checked (verify any number yourself)
• TradingView — SOL/USDT live quotes & chart. (TradingView)
• Binance — SOL/USDT spot 24h high/low used for volatility input. (Binance)
• CoinMarketCap — SOL price, market cap, volume. (CoinMarketCap)
• CoinGecko — price and volume snapshots. (CoinGecko)
• TradingView idea threads for technical zone context & sentiment. (TradingView)
“Liked this SOL brief? Click here for previous SOL analysis and see how our ranges compared. Subscribe to One Web One Hub for daily probability-driven briefs and free volatility calculators. Comment below — which token should we analyze next?”


