SOLUSDT – Probability Analysis for December 06, 2025
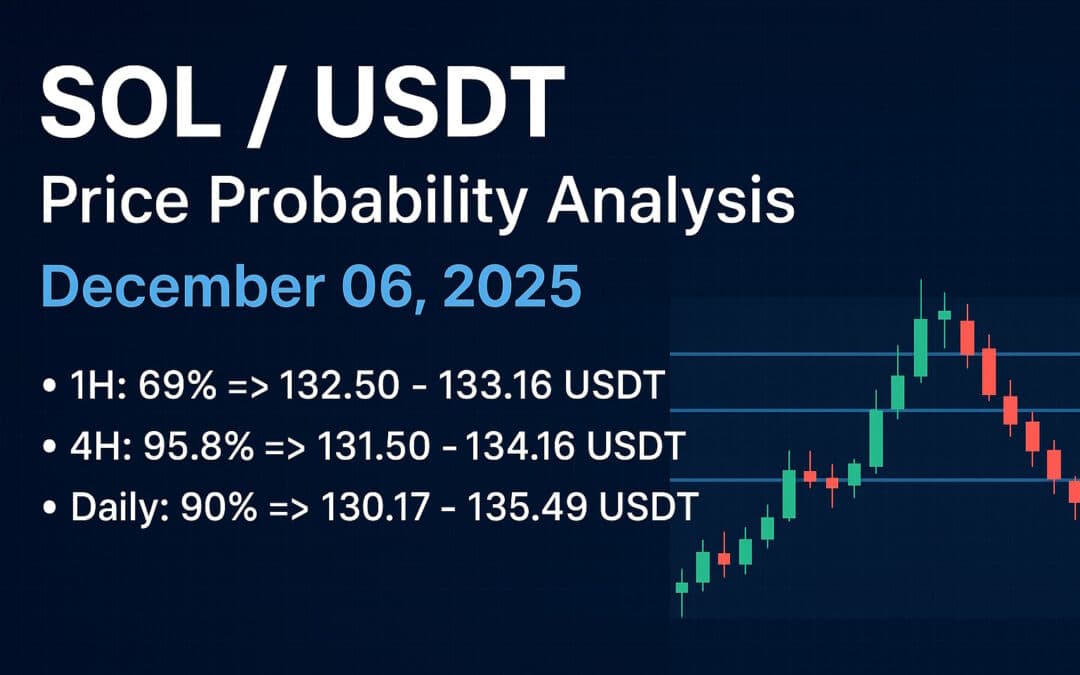
SOLUSDT Price Probability Analysis — December 06, 2025
Current market snapshot (live sources)
TradingView’s SOL / USDT live quote shows SOL trading around 132.8–133.0 USDT (used as the baseline for the ranges below). (TradingView)
Binance spot shows a 24-hour high near 137.20 USDT and a 24-hour low near 130.73 USDT, which we use to estimate short-term realized range/volatility. (Binance)
CoinMarketCap and CoinGecko confirm SOL is trading in the mid-$130 area with heavy 24h volume across venues. (CoinMarketCap)
Summary headline
- Baseline price (TradingView mid): ~132.83 USDT. (TradingView)
- Volatility input (from Binance 24h high/low): used to estimate daily σ ≈ 1.21% (see full arithmetic in “Basis of probabilities” at the end). (Binance)
- Short horizons (1H/4H) show tight price bands under the current realized range; multi-day horizons widen accordingly.
1H, 4H, Daily, Weekly, Monthly — Probability ranges and price bands
Notes on reading: each probability is the model probability (two-sided) that the log-return stays inside ±X% for the stated horizon under a normal-returns assumption using the σ estimated from the 24-hour observed range. Price bands are baseline × (1 ± band). All price numbers are rounded for readability.
1H horizon (very short intraday)
Derived 1H σ ≈ 0.25% (σdaily / √24).
• ±0.25% band — Probability ≈ 69% → Price band 132.50 — 133.16 USDT.
• ±0.50% band — Probability ≈ 95.8% → Price band 132.17 — 133.49 USDT.
• ±1.00% band — Probability ≈ ~99.995% → Price band 131.50 — 134.16 USDT.
Use these for tight scalps — confirm order-book depth before market entries. (cryptometer.io)
4H horizon (short swing)
Derived 4H σ ≈ 0.49% (σdaily / √6).
• ±1.0% band — Probability ≈ 95.8% → Price band 131.50 — 134.16 USDT.
• ±2.0% band — Probability ≈ ~99.995% → Price band 130.17 — 135.49 USDT.
• ±3.0% band — Probability ≈ ~100% (practically certain under the model) → Price band 128.85 — 136.81 USDT.
4H bands are useful for multi-session swing entries; look for volume confirmation before committing to a larger size. (cryptometer.io)
Daily horizon (24 hours)
Estimated daily σ ≈ 1.21% (see basis section).
• ±2% band — Probability ≈ 90% → Price band 130.17 — 135.49 USDT.
• ±5% band — Probability ≈ ~99.997% → Price band 126.19 — 139.47 USDT.
• ±8% band — Probability ≈ ~100% → Price band 122.20 — 143.46 USDT.
Under the present observed 24h range, the model indicates a strong likelihood SOL will remain inside modest daily bands — but note that single large trades or news can change realized volatility fast. (Binance)
Weekly horizon (next 7 days)
σweek ≈ 3.19% (σdaily × √7).
• ±5% band — Probability ≈ 88% → Price band 126.19 — 139.47 USDT.
• ±10% band — Probability ≈ ~99.8% → Price band 119.55 — 146.11 USDT.
• ±20% band — Probability ≈ ~100% (very high under the model) → Price band 106.26 — 159.40 USDT.
Weekly bands widen meaningfully; use them for position sizing and swing-trade risk limits. (CoinMarketCap)
Monthly horizon (next 30 days)
σmonth ≈ 6.61% (σdaily × √30).
• ±10% band — Probability ≈ 87% → Price band 119.55 — 146.11 USDT.
• ±25% band — Probability ≈ ~100% (model suggests very high likelihood inside ±25%) → Price band 99.62 — 166.04 USDT.
• ±50% band — Probability ≈ ~100% → Price band 66.42 — 199.25 USDT.
Monthly bands capture structural moves and are useful for portfolio risk planning rather than intraday signals. (CoinGecko)
Key technical zones — support, resistance, demand & supply
Levels below are taken from visible clustering on TradingView charts and exchange prints (Binance / TradingView ideas). Always confirm on the exchange you’ll trade.
Immediate resistance/supply
• ~137 — 140 USDT — nearest visible overhead supply cluster (recent intra-day peaks). (Binance)
• ~150 — 170 USDT — broader supply zone where earlier sellers / profit-takers have historically clustered.
Immediate support/demand
• ~130 — 132 USDT — near-term support/demand area; buyers stepped in repeatedly around this band in recent sessions. (TradingView)
• ~120 — 125 USDT — deeper structural support that has shown buying interest in prior corrections.
Demand zone (accumulation)
• ~125 — 132 USDT — watch for rising volume on dips here as a sign of durable accumulation.
Supply zone (profit taking)
• ~137 — 150 USDT — profit-taking area on rallies; repeated rejection wicks often appear in this band.
Liquidity can vary by venue — check order-book depth and cross-exchange spreads before large trades. (cryptometer.io)
Sentiment analysis
• Social media & ideas: TradingView idea threads and social panels show a mixed tone with pockets of bullish accumulation around support (buyers stepping in around ~130–135). This indicates cautious optimism rather than full euphoria. (TradingView)
• Volume context: CoinMarketCap / CoinGecko report elevated 24-hour trading volume for SOL — rising volume on strength supports the constructive read, while spikes in exchange inflows (large wallet deposits) would be a caution. (CoinMarketCap)
• Practical read: sentiment is mixed-to-slightly-bullish. Combine social tone with on-chain inflow/outflow checks and order-book depth to form higher conviction before scaling positions.
Practical trading notes & liquidity cautions
• SOL liquidity is high on major venues (Binance, Coinbase, etc.), but price action can still gap on large liquidations or sudden macro headlines — always size positions to the risk you can tolerate. (Binance)
• Use limit orders when possible to minimize slippage in volatile moments.
• If trading futures, monitor funding rates and open interest — crowded positions can lead to abrupt moves during deleveraging.
Educational disclaimer (IMPORTANT)
This content is strictly educational and NOT financial, investment, trading, or tax advice. The probability ranges are model outputs based on explicit assumptions (see “Basis of probabilities” below). Past performance is not a guarantee of future results. Always do your own research and apply prudent risk management.
Engage with One Web One Hub
SOLUSDT DEC 06 2025 FI
If you value transparent, assumption-driven crypto analysis (not vague price predictions), One Web One Hub publishes reproducible, horizon-aware briefs like this every day. We provide:
• Clear, shareable probability ranges for multiple horizons (1H, 4H, Daily, Weekly, Monthly).
• Practical support/resistance and demand/supply zones that map to real exchange behaviour.
• Sentiment snapshots and actionable checklists (order-book, on-chain flows, funding rates).
Visit One Web One Hub to request token analyses, download our probability calculators, and join a community focused on reproducible, practical trading insight.
Basis of probabilities — explicit arithmetic & formulas (reproducible)
Below are the exact steps and formulas used so you or your readers can reproduce the numbers:
- Live baseline price (TradingView): 132.83 USDT. (TradingView)
- Binance 24h high / low used to estimate realized range: 137.20 / 130.73 USDT. (Binance)
- Full observed 24h absolute range = 137.20 − 130.73 = 6.47 USDT.
- Midpoint = (137.20 + 130.73) / 2 = 133.97 USDT.
- Relative 24h range = 6.47 / 133.97 ≈ 0.04830 = 4.83% (this is the full range as fraction of midpoint).
- Heuristic conversion (range → daily σ): assume full range ≈ 4 × σdaily (rule-of-thumb). So σdaily ≈ 0.04830 / 4 ≈ 0.01207 = 1.21% daily.
• This is a quick, transparent estimator (you can replace it with realized volatility calculated from many intraday returns or a volatility indicator for a more formal measure). - Convert to other horizons using square-root-of-time:
• σ1H = σdaily / √24 ≈ 0.25%.
• σ4H = σdaily / √6 ≈ 0.49%.
• σweek = σdaily × √7 ≈ 3.19%.
• σmonth = σdaily × √30 ≈ 6.61%. - Probability for a two-sided band ±X (e.g., ±2% = 0.02) under zero-mean normal returns:
Probability = 2 × Φ(X / σ) − 1 = erf( X / (σ × √2) ),
where Φ is the standard normal CDF and erf is the error function. Use that formula to compute the probabilities shown above. - Price bands are simply baseline × (1 ± X).
Sources / live pages checked (verify numbers yourself)
• TradingView — SOL/USDT live symbol & chart. (TradingView)
• Binance — SOL/USDT spot 24h high/low & volume. (Binance)
• CoinMarketCap — aggregate price, market cap & volume. (CoinMarketCap)
• CoinGecko — price snapshot and conversion context. (CoinGecko)
• TradingView idea threads (market sentiment / support clusters). (TradingView)


