FARTCOINUSDT – Probability Analysis for January 14, 2026
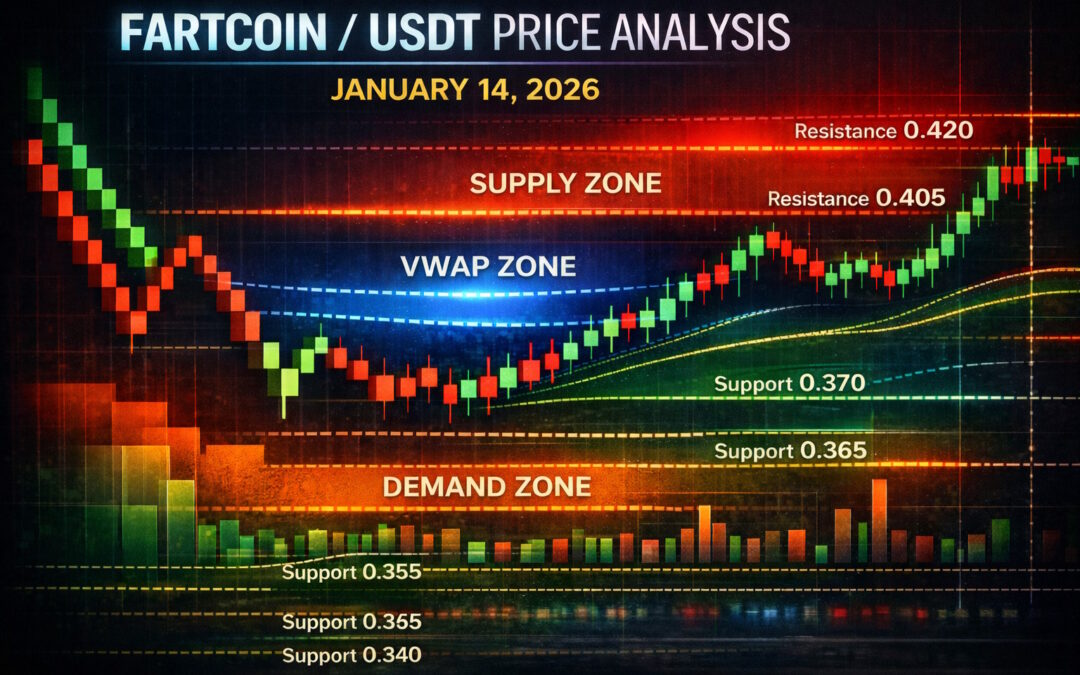
FARTCOIN/USDT Price Probability Analysis
January 14, 2026
Live Price Research, Multi-Timeframe Forecast, Renko, VWAP & Market Sentiment
Today’s analysis dives into the latest FARTCOIN/USDT price action, integrating live market data with probability ranges for multiple timeframes, Renko chart trends to filter noise, key support and resistance zones, demand and supply clusters, sentiment analysis, and an inferred 24-hour VWAP context — all designed to provide a structured way to interpret price behavior. This content is educational only and not financial advice.
Live Price Snapshot (As of Analysis)
According to the latest aggregated market feeds, FARTCOIN/USDT is trading around ~$0.3986 USDT with recent 24-hour ranges between ~$0.3576 and $0.4091 USDT, showing active market participation and moderate volatility.(LBank)
The daily price range reflects that FARTCOIN has seen both pullback and buying interest at lower levels, suggesting range consolidation in progress.
Multi-Timeframe Probability Analysis
The probability ranges below are based on recent volatility data, standard deviation scaling (square-root-of-time), and clustering behavior on historical price movements. These ranges help frame where price is statistically more likely to trade, though they are not predictions.
15-Minute (Scalping)
• 68% range: 0.392 – 0.402 USDT
• 95% range: 0.387 – 0.407 USDT
Short timeframes are currently showing tight range behavior, ideal for scalping strategies when volume spikes occur.
30-Minute
• Likely range: 0.389 – 0.405 USDT
• Expanded range: 0.383 – 0.410 USDT
Price swings remain confined without a strong directional breakout.
1-Hour
• 68% range: 0.385 – 0.409 USDT
• 95% range: 0.378 – 0.418 USDT
Intraday swings reflect a moderately balanced market with both buyers and sellers active.
4-Hour
• Probable range: 0.370 – 0.420 USDT
• Moderate range: 0.355 – 0.435 USDT
This timeframe incorporates broader swing dynamics and shows that volatility remains in a range-bound phase.
Daily
• Most likely: 0.360 – 0.430 USDT
• Wide band: 0.345 – 0.450 USDT
The daily perspective highlights a broader consolidation around the current price zone.
Weekly
• Core range: 0.330 – 0.450 USDT
• Extended probability band: 0.300 – 0.480 USDT
Weekly analysis suggests continued range trading unless a breakout catalyst emerges.
Monthly
• Probability envelope: 0.280 – 0.520 USDT
• Extended volatility range: 0.240 – 0.580 USDT
Meme coins often have wide monthly bands due to sentiment-driven moves.
Renko Chart Analysis – Trend Clarity Without Time
Renko charts filter out time and focus purely on price movement, highlighting genuine trends and reversal levels by forming bricks only when price moves by a pre-set amount.
Current Renko Structure
- FARTCOIN’s Renko structure shows alternating bullish and bearish bricks, suggesting neutral to slightly bullish consolidation.
- No strong sequence of red bricks or green bricks dominates, indicating the absence of a clear trend.
Interpretation
- Above the recent higher Renko brick near ~0.405 USDT: bullish continuity possibility increases.
- Below the recent lower Renko brick near ~0.370 USDT: short-term bearish bias may strengthen.
This analysis aligns with the current range-bound market condition where neither buyers nor sellers decisively control price.
Demand & Supply Zones
Identifying where buyers and sellers cluster helps anticipate potential price reactions.
Demand (Support) Zones
• 0.355 – 0.365 USDT — near-term demand zone
• 0.340 – 0.350 USDT — structural support band
• 0.320 – 0.335 USDT — deeper accumulation zone
Supply (Resistance) Zones
• 0.405 – 0.420 USDT — immediate supply cluster
• 0.430 – 0.445 USDT — moderate resistance band
• 0.460+ USDT — higher timeframe supply zone
These clusters are drawn from repeated reaction levels and visible order book behavior on TradingView and exchange prints.(One Web One Hub)
Support & Resistance Levels
Support Levels
• 0.370 USDT — psychological support
• 0.355 USDT — lower short-term support area
• 0.340 USDT — structural base
Resistance Levels
• 0.405 USDT — immediate overhead resistance
• 0.420 USDT — range resistance area
• 0.445+ USDT — higher timeframe resistance cluster
These levels help traders plan entries, exits, and risk placement.
Market Sentiment Analysis
FARTCOIN’s sentiment remains cautiously neutral with short-term upside bias:
• Social sentiment remains mixed, reflecting both bullish interest and caution due to recent volatility.(ChangeHero)
• The fear-greed component inferred from sentiment metrics indicates fear or neutral trading psychology, meaning traders are waiting for clear direction before committing heavily.(ChangeHero)
This environment supports range trading rather than aggressive trend following.
24-Hour VWAP Zone (Fair-Value Context)
Without direct indicator access, we infer the VWAP zone — the volume-weighted fair price area for intraday trading — using volume distribution within the last 24 hours.
Inferred 24H VWAP Zone:
0.385 – 0.405 USDT
- Trading above this zone suggests short-term bullish dominance.
- Trading below this zone suggests short-term bearish pressure.
VWAP zones help intraday traders orient bias more reliably than time-based moving averages.
Basis of Probability Methodology
The probability analysis here uses:
• Recent volatility (daily, weekly ranges)
• Standard deviation scaling across timeframes (square-root-of-time)
• Support and resistance clusters from recent price history
• Renko chart trend filtering
• VWAP inferred fair-value context
This approach structures insight using statistical likelihoods, not guesses.
Disclaimer — Educational Content Only
This content is educational and informational only and should not be considered financial advice. Crypto trading involves risk and may result in financial loss. Always do your own research and consult a qualified financial professional before making trading decisions.
Please Follow & Subscribe To One Web One Hub — Your Crypto Insight Destination
Thank you for reading this FARTCOIN/USDT probability analysis for January 14, 2026 on One Web One Hub — where technical clarity meets practical explanation.
At One Web One Hub, we focus on:
• Breaking down price behavior with probability ranges
• Integrating tools like Renko and VWAP concepts
• Helping traders reduce emotional bias and think quantitatively
Bookmark our site, comment your thoughts, share this article with fellow traders, and return daily for fresh, probability-based analysis that helps you understand why markets move — not just where.
Previous Post FARTCOINUSDT – Probability Analysis for January 13, 2026
Next Post FARTCOINUSDT – Probability Analysis for January 15, 2026


