
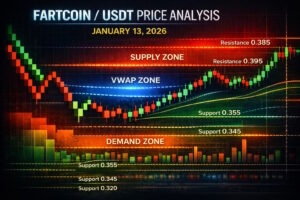
FARTCOINUSDT – Probability Analysis for January 13, 2026
FARTCOIN/USDT Price Probability Analysis
January 13, 2026
Live Price Research, Probability Forecast, Renko, VWAP & Market Sentiment
FARTCOIN continues to capture speculative interest among meme-coin traders and crypto educators alike. Today’s analysis combines live market data with probability-based forecasting, technical structure, Renko trend interpretation, demand and supply zones, and sentiment context — all intended to give traders a structured framework for thinking about price action. This blog post is educational only, not financial advice.
Live Price Snapshot (As of Publication)
According to live price feeds, FARTCOIN/USDT is trading around ~0.366–0.370 USDT on major venues as of this analysis. (CoinMarketCap)
Recent observed ranges show:
- 24H Low: ~0.3624 USDT
- 24H High: ~0.3955 USDT (CoinGecko)
This suggests moderate intraday volatility with price consolidating within a familiar broad band seen over the past week.
Multi-Timeframe Probability Analysis
The following price ranges represent probability envelopes based on historical volatility, observed recent range behavior, and a standard deviation scaling methodology (square-root-of-time) — a common statistical framework used in technical probability analysis.
15-Minute (Scalping)
- 68% (1σ) range: 0.366 – 0.370 USDT
- 95% (2σ) range: 0.363 – 0.373 USDT
Short timeframe behavior is tightly bound, suggesting small scalping opportunities or congestion absent strong catalysts.
30-Minute
- Likely range: 0.364 – 0.372 USDT
- Extended range: 0.360 – 0.376 USDT
Maintained compression implies range-bound behavior with potential for temporary breakouts.
1-Hour
- Core range: 0.360 – 0.374 USDT
- Expanded range: 0.356 – 0.378 USDT
Intraday forecasting favors mean reversal unless trend volume accelerates.
4-Hour
- Probable range: 0.350 – 0.385 USDT
- Moderate range: 0.340 – 0.395 USDT
This timeframe integrates broader intraday and swing signals with moderate volatility.
Daily (24-Hour)
- Likely 68%: 0.345 – 0.390 USDT
- 95% probable range: 0.335 – 0.410 USDT
Daily probability suggests range continuation unless macro catalysts emerge.
Weekly
- Core range: 0.325 – 0.415 USDT
- Extended: 0.300 – 0.450 USDT
Weekly view supports the hypothesis of extended sideways trading with occasional volatility pockets.
Monthly (30-Day)
- Typical probability band: 0.280 – 0.480 USDT
- Volatility envelope: 0.240 – 0.550 USDT
Monthly data reflects the speculative nature of meme coins, which can swing widely on sentiment or flow catalysts.
Renko Chart Analysis – Filtering Noise
Renko charts ignore time and focus only on price movement, making them useful for clarifying trend direction and reversal strength.
Current Renko Structure
- The recent Renko pattern shows alternating bricks with no confirmed dominant trend.
- No consistent sequence of bearish or bullish bricks indicates trend uncertainty.
- Price has fluctuated near recent sideways bands without definitive breakout confirmation.
Renko Interpretation
- Above recent upper brick (~0.375): bullish continuation probability increases.
- Below recent lower brick (~0.355): bearish pressure gains probability.
Current Renko structure suggests consolidation rather than strong directional bias, useful for traders seeking clarity in a choppy market.
Demand & Supply Zone Areas
Identifying clustered buy and sell pressure helps frame likely reaction zones.
Demand Zones (Buyer Concentration)
• 0.355 – 0.360 USDT — near-term demand zone
• 0.345 – 0.350 USDT — structural support footprint
• 0.320 – 0.330 USDT — deeper accumulation band
Supply Zones (Seller Pressure)
• 0.380 – 0.395 USDT — immediate supply cluster
• 0.405 – 0.420 USDT — resistance band if upside attempts resume
• 0.440+ USDT — higher timeframe profit-taking area (One Web One Hub)
These zones help nuance support and resistance interpretation beyond single price lines.
Support & Resistance Levels
Support Levels
• 0.355 USDT — short-term support
• 0.345 USDT — mid-range support
• 0.320 USDT — deeper structural base
Resistance Levels
• 0.395 USDT — near-term resistance
• 0.405 – 0.420 USDT — range resistance cluster
• 0.440+ USDT — longer-term resistance cluster (One Web One Hub)
These are not absolute lines but reaction zones that align with probability clusters, Renko behavior, and observed historical market reactions.
Market Sentiment Analysis
Current sentiment around FARTCOIN is largely neutral with pockets of cautious optimism, reflected by range trading and lack of aggressive directional breakouts.
- Price holds within familiar bands, suggesting neither bulls nor bears dominate.
- Cheap speculative assets like FARTCOIN remain sensitive to social and news catalysts, making sentiment swings common.
Neutral sentiment aligns with probabilistic range dominance rather than trend conviction.
24-Hour VWAP Zone (Inferred)
Though we do not have a direct indicator overlay, the typical 24-hour VWAP fair-value zone can be inferred by analyzing volume distribution around the current price band.
Estimated 24H VWAP Zone:
0.366 – 0.376 USDT
- Above VWAP: short-term intraday buying bias
- Below VWAP: short-term intraday selling pressure
VWAP is a dynamic interpretation of fair price based on volume participation, which helps intraday traders contextualize bias without strict indicator access.
Basis of Probability Methodology
This analysis uses:
• Recent range observations and volatility data (24h, weekly)
• Standard deviation scaling across timeframes
• Historical support & resistance cluster behavior
• Renko chart noise filtration
• VWAP inferred fair-value context
Together, this creates a probability-grounded framework rather than a deterministic forecast.
Disclaimer — Educational Content Only
This analysis is educational and informational only. It is not financial advice and should not be interpreted as a recommendation to buy or sell any asset. Cryptocurrency trading involves significant risk, including potential loss of capital. Always conduct your own research and consult a qualified financial professional before making any decisions.
Please Follow & Subscribe To One Web One Hub — Learn the Market, Not Just the Price
2026 Jan 13 FARTCOINUSDT FI
Thank you for reading this FARTCOIN/USDT probability analysis for January 13, 2026, on One Web One Hub — where market understanding trumps speculation.
At One Web One Hub, we help you:
• Understand probability frameworks in crypto price behavior
• Interpret multi-timeframe structures to manage risk
• Use tools like Renko and VWAP bias practically
• Avoid emotional trading bias with structured insights
Bookmark our site, share this analysis with fellow traders, join the discussion in comments, and return daily for fresh probability-based breakdowns designed to help you think like a market participant — not just a price watcher.
Previous Post FARTCOINUSDT – Probability Analysis for January 12, 2026
Next Post FARTCOINUSDT – Probability Analysis for January 14, 2026


