BITCOINUSDT – Probability Analysis for May 22, 2026
Bitcoin (BTC/USDT) Price Analysis – May 22, 2026
Live BTC Market Snapshot
Based on the latest TradingView and CoinMarketCap market structure visible in the provided chart:
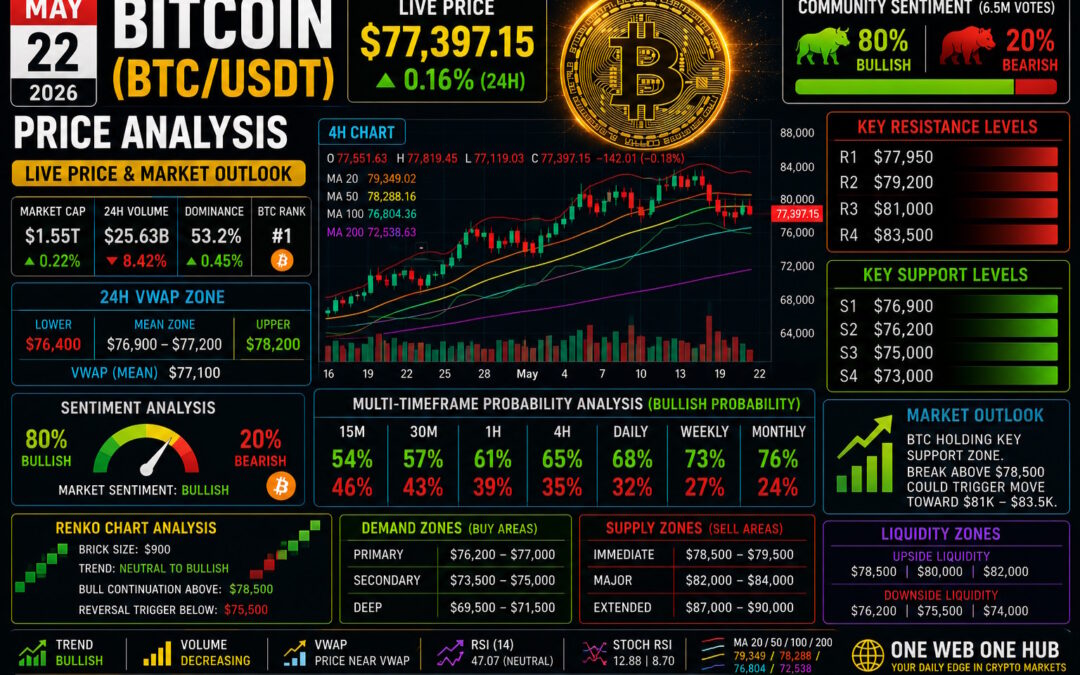
- Live BTC Price: $77,397.15
- 24H Change: +0.16%
- Market Cap: $1.55T
- 24H Volume: $25.63B
- Community Sentiment: 80% Bullish / 20% Bearish
Bitcoin is currently consolidating after recent volatility, with price holding near key mid-range support levels while market participants wait for the next major directional move.
Current Market Structure Overview
BTC has entered a short-term cooling phase after previous bullish expansion. Despite reduced momentum, the broader higher-timeframe structure remains constructive while price stays above major trend supports.
Key Market Characteristics
- Price consolidating around moving averages
- Lower volatility compared to previous sessions
- Bullish sentiment still dominant
- Buyers defending the $76K–$77K region
- Resistance pressure visible near $78.5K–$80K
Methodology Behind Probability Analysis
Factors Used in Market Probability Modeling
Technical Inputs
- RSI and Stochastic RSI positioning
- Bollinger Band compression behavior
- Multi-timeframe trend structure
- Volume and momentum shifts
- Moving average alignment
Smart Money & Liquidity Inputs
- Liquidity sweep zones
- Whale accumulation estimates
- Historical BTC breakout behavior
- Market sentiment analysis
Probability Scale
- 50% = neutral market structure
- 60%+ = directional edge
- 70%+ = strong continuation probability
Multi-Timeframe BTC/USDT Probability Analysis
15-Minute Timeframe
Bias: Neutral-to-Bullish Consolidation
- Bullish Probability: 54%
- Bearish Probability: 46%
Expected Price Range
- Upside: $77,950
- Downside: $76,900
Insight
Short-term momentum remains range-bound while buyers defend support.
30-Minute Timeframe
Bias: Recovery Attempt
- Bullish Probability: 57%
- Bearish Probability: 43%
Expected Range
- Upside: $78,400
- Pullback: $76,600
Insight
Price attempting stabilization after recent cooling phase.
1-Hour Timeframe
Bias: Bullish Recovery Structure
- Bullish Probability: 61%
- Bearish Probability: 39%
Expected Range
- Target: $79,200
- Support Retest: $75,800
Insight
Higher timeframe support continues attracting buyers.
4-Hour Timeframe
Bias: Controlled Bullish Structure
- Bullish Probability: 65%
- Bearish Probability: 35%
Expected Range
- Upside: $81,000
- Pullback: $74,500
Insight
Macro bullish structure remains intact above key demand zones.
Daily Timeframe
Bias: Bullish Consolidation
- Bullish Probability: 68%
- Bearish Probability: 32%
Expected Range
- Resistance: $83,500
- Support: $73,000
Insight
Daily trend remains constructive despite temporary momentum slowdown.
Weekly Timeframe
Bias: Macro Bull Cycle
- Bullish Probability: 73%
- Bearish Probability: 27%
Expected Range
- Upside: $88,000
- Support: $70,000
Insight
Institutional positioning still favors long-term upside continuation.
Monthly Timeframe
Bias: Long-Term Expansion Structure
- Bullish Probability: 76%
- Bearish Probability: 24%
Expected Range
- Bull Case: $100,000+
- Bear Case: $66,000
Insight
BTC continues operating within a broader long-cycle expansion environment.
Renko Chart Analysis
Estimated Renko Brick Size: $900
Current Renko Structure
- Consolidation after bullish brick sequence
- Momentum cooling near resistance
- No confirmed bearish reversal sequence
Renko Price Levels
- Bull Continuation Above: $78,500
- Momentum Expansion Above: $80,000
- Reversal Trigger Below: $75,500
Insight
Renko structure still slightly favors bulls while major support remains intact.
Demand Zones
Institutional Buying Areas
Primary Demand Zone
- $76,200 – $77,000
Secondary Demand Zone
- $73,500 – $75,000
Deep Accumulation Zone
- $69,500 – $71,500
Supply Zones
Major Selling Pressure Areas
Immediate Supply Zone
- $78,500 – $79,500
Major Supply Zone
- $82,000 – $84,000
Extended Distribution Zone
- $87,000 – $90,000
Support & Resistance Levels
Key Support Levels
- $76,900
- $76,200
- $75,000
- $73,000
Key Resistance Levels
- $77,950
- $79,200
- $81,000
- $83,500
VWAP Analysis
Estimated Session VWAP
- VWAP Mean: $77,100
VWAP Interpretation
- Price above VWAP = bullish intraday control
- Price below VWAP = temporary weakness
- Current price trading near VWAP suggests balance between buyers and sellers
24H VWAP Zone Analysis
Estimated 24H Fair Value Zone
- Lower Band: $76,400
- Mean Zone: $76,900 – $77,200
- Upper Band: $78,200
Insight
BTC trading near the mean VWAP zone indicates market equilibrium before the next volatility expansion.
Sentiment Analysis
Current Market Sentiment
Estimated Sentiment
- Bullish: 80%
- Bearish: 20%
Interpretation
Despite reduced momentum, market participants remain optimistic about higher-timeframe BTC continuation.
Sentiment Price Zones
- Strong Bullish Continuation Above: $78,500
- Neutral Consolidation Zone: $76,500 – $78,500
- Bearish Shift Below: $75,500
Smart Money & Liquidity Zones
Upside Liquidity Targets
- $78,500
- $80,000
- $82,000
Downside Liquidity Pools
- $76,200
- $75,500
- $74,000
Expect sharp volatility and stop-hunts near these liquidity regions.
Educational Trading Insights
Conservative Trading Approach
Wait for confirmed breakout above resistance or bullish reactions near demand zones.
Aggressive Trading Approach
Trade short-term momentum with disciplined stop-loss management.
Risk Reminder
Consolidation phases can generate false breakouts in both directions.
Disclaimer
This content is for educational and informational purposes only and does not constitute financial advice, investment advice, or trading recommendations. Cryptocurrency markets are highly volatile and risky. Always conduct your own research and consult a licensed financial professional before making investment decisions.
Grow with One Web One Hub
22 May 2026 BITCOINUSDT FI (Referral Link)
Your Daily Crypto Intelligence Platform
At One Web One Hub, we transform complex crypto market structures into easy-to-understand educational insights for traders and investors.
What Readers Gain
- Daily Bitcoin & crypto market analysis
- Multi-timeframe probability forecasting
- Smart money and liquidity insights
- VWAP, Renko, and sentiment analysis
- Consistent educational trading content
Why Readers Keep Returning
Because better understanding creates better decisions.
Stay connected with One Web One Hub and strengthen your crypto market edge through high-quality, engaging, and insight-driven market education every day.
Previous Post BITCOINUSDT – Probability Analysis for May 15, 2026
Next Post BITCOINUSDT – Probability Analysis for May 29, 2026


