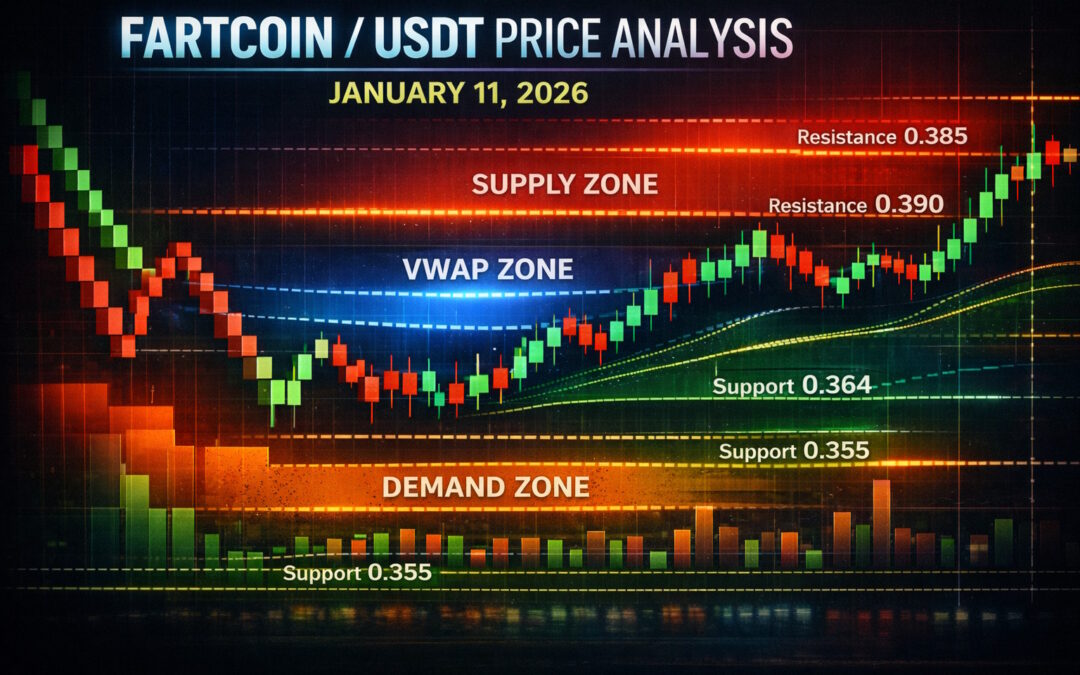
FARTCOINUSDT – Probability Analysis for January 11, 2026
FARTCOIN/USDT Price Probability Analysis
January 11, 2026
Live Price Research, Multi-Timeframe Forecast, Renko, VWAP & Market Sentiment
FARTCOIN continues to draw attention in the meme coin sector with its blend of speculative price action and community-driven momentum. In this analysis, we use current live price data, statistical probability ranges across timeframes, trend interpretation via Renko charts, demand and supply zones, and inferred VWAP behavior to help traders and readers understand likely price behavior. This is educational insight, not financial advice.
Live Price Snapshot (As of Analysis)
According to real-time converters and live price trackers, FARTCOIN/USDT is trading around ~0.367 USDT per token at the time of writing. (CoinMarketCap)
In recent days, prices have shown a mild downward shift from levels near ~0.403 USDT, with a current market price reflecting consolidation around the ~0.36–0.37 band. (CoinMarketCap)
Multi-Timeframe Price Probability Analysis
These price probability ranges are based on observed price behavior, recent volatility statistics, and a standard deviation scaling approach (square-root-of-time) to estimate likely price movement envelopes. This method isn’t predictive — it frames statistically likely zones.
15-Minute (Scalping Context)
- 68% probability range: 0.365 – 0.369 USDT
- 95% range: 0.362 – 0.372 USDT
Short timeframes show tight movement — ideal for scalpers watching for quick swings.
30-Minute (Micro Short)
- Most probable (≈68%): 0.364 – 0.370 USDT
- Wider (≈95%): 0.360 – 0.374 USDT
Likely activity remains focused within a narrow band, barring volume spikes.
1-Hour (Intraday)
- 68% range: 0.362 – 0.372 USDT
- 95% range: 0.358 – 0.376 USDT
This range suggests intraday mean reversion tendencies in the absence of strong trend drivers.
4-Hour (Short Swing)
- Probable range: 0.355 – 0.380 USDT
- Moderate range: 0.345 – 0.390 USDT
Here, the broader trend bias still seems range-bound with moderate volatility.
Daily (24-Hour)
- Most likely: 0.350 – 0.385 USDT
- Expanded: 0.340 – 0.400 USDT
Daily probabilities indicate that the price is consolidating with potential for range extension.
Weekly
- 68% range: 0.330 – 0.405 USDT
- 95% range: 0.310 – 0.430 USDT
Weekly perspectives reinforce that the short-term structure is not trending sharply but is balancing.
Monthly (30-Day)
- Main range: 0.300 – 0.450 USDT
- Volatility envelope: 0.270 – 0.500 USDT
Longer timeframes allow for broader swings given meme coin volatility.
Renko Chart Analysis – Trend Clarity Without Time
Renko charts focus purely on price movement, filtering out time-based noise. They help highlight trend direction and reversal strength.
Current Renko Behavior
- Recent Renko bricks suggest neutral consolidation with a slight bearish bias due to recent down moves.
- No confirmed sequence of red bricks dominating, meaning the structure is not in a confirmed downtrend.
- A shift above the most recent upper Renko brick zone (~0.372) could signal renewed buying pressure.
Renko Insight: Price is in a trend hesitation zone, not a confirmed breakout or breakdown.
Demand & Supply Zones
Identifying where buyers and sellers historically react helps define strategic zones.
Demand (Support) Zones
• 0.355 – 0.360 USDT — near-term demand cluster
• 0.345 – 0.350 USDT — structural buyers
• 0.320 – 0.335 USDT — deeper accumulation region
Supply (Resistance) Zones
• 0.378 – 0.385 USDT — immediate supply rejection zone
• 0.390 – 0.405 USDT — moderate profit-taking band
• 0.420+ USDT — higher timeframe supply if breakout occurs (One Web One Hub)
These zones help define where price is likely to encounter buying or selling pressure.
Support & Resistance
Support Levels
• 0.355 USDT — short-term support
• 0.345 USDT — structural support
• 0.320 USDT — deeper basis
Resistance Levels
• 0.378 USDT — near-term resistance
• 0.390 USDT — moderate ceiling
• 0.405 USDT+ — upper resistance cluster (One Web One Hub)
Understanding these levels helps with planning entries, exits, and risk limits.
Market Sentiment Analysis
Sentiment around FARTCOIN remains mixed to cautiously neutral:
- Community interest in Fartcoin continues, but without a strong dominant sentiment, price consolidation persists.
- Meme coin markets can be driven quickly by social catalysts and volume spikes, making typical trend indicators less reliable without volume confirmation.
- Broader market activity and Solana ecosystem trends can spill over into FARTCOIN behavior, making sentiment oscillate quickly.
Sentiment reinforces the idea that price may remain range-bound until a clear catalyst shifts bias.
24-Hour VWAP Zone (Fair Value Bias)
Without direct access to the VWAP indicator, we infer the 24-hour VWAP fair-value zone based on the current 24-hour range and volume clustering:
Estimated VWAP Zone: 0.364 – 0.374 USDT
- Trading above this zone suggests a relative intraday bullish bias.
- Trading below this zone indicates short-term bearish pressure.
VWAP helps traders orient intraday bias rather than predicting pure direction.
Probability Methodology Basis
Our probability ranges are based on:
- Observed recent price volatility
- Standard deviation scaled by the square root of time across timeframes
- Clustered support & resistance from recent trading behavior
- Renko trend filtering to reduce noise
- Inferred VWAP fair-value context
This creates a structured framework versus random guessing.
Disclaimer — Educational Content Only
This analysis is educational and informational only and should not be interpreted as financial advice. Cryptocurrency trading is high risk and may result in financial loss. Always conduct your own research and consider consulting a financial professional before making investment decisions.
Please Follow & Subscribe To One Web One Hub
2026 Jan 11 FARTCOINUSDT FI
Thank you for reading our FARTCOIN/USDT analysis for January 11, 2026, on One Web One Hub — the place where market structure meets probability-based thinking.
At One Web One Hub:
- We help you think statistically, not emotionally
- We explain how technical levels and probability ranges matter
- We break down complex concepts like Renko and VWAP bias into clear insight
Bookmark our site, share with fellow traders, and return daily for high-quality probability and trend analysis designed to help you understand markets better — and trade with more confidence.
Previous Post FARTCOINUSDT – Probability Analysis for January 10, 2026
Next Post FARTCOINUSDT – Probability Analysis for January 12, 2026


