
FARTCOINUSDT – Probability Analysis for January 10, 2026
FARTCOIN/USDT Price & Probability Analysis
January 10, 2026 — Live Market Update & Multi-Timeframe Trading Insight
Live Price Snapshot (as of now)
The current live price of FARTCOIN/USDT is approximately 0.3665 USDT per coin based on the latest data aggregators (CoinMarketCap live price) — note that crypto prices update every second, so check your platform before trading. (CoinMarketCap)
Price range 24h:
• Low ~0.34–0.36 USDT
• High ~0.38–0.40 USDT
This indicates the token remains in a consolidation band with modest intraday volatility. (CoinMarketCap)
Multi-Timeframe Probability Analysis
We use a probability-based framework derived from historic price range statistics combined with current price action to outline likely price behavior across timeframes. The model assumes returns approximate a normal distribution (log returns) scaled to the timeframe via the square-root-of-time — a standard statistical approach used in financial analysis. (One Web One Hub)
15-Minute (Scalping / Micro)
With lower timeframe volatility scaled from daily ranges:
• 68% event band: ~ ±0.3–0.5% → 0.365 – 0.368 USDT
• 95% event band: ~ ±1% → 0.363 – 0.370 USDT
This indicates a tight intraday zone where scalpers may look for quick bounces or rejections.
30-Minute (Short Snipes)
• Most probable (≈68%): 0.362 – 0.372 USDT
• Extended (≈95%): 0.358 – 0.376 USDT
Look for mean reversion plays within these rapid bands.
1-Hour (Trend Play)
• 68% range: ~0.360 – 0.372 USDT
• 95% range: ~0.355 – 0.380 USDT
Here, key candlestick patterns and volume confirm direction.
4-Hour (Short Swing)
• Local swing range ~0.352 – 0.372 USDT (±2% most likely)
• Moderate range ~0.338 – 0.386 USDT
• Wider range ~0.325 – 0.399 USDT on volatility expansions (One Web One Hub)
This aligns with active sellers above ~0.38 and buyers near ~0.33.
Daily (24-Hour)
• Probable range: 0.342 – 0.388 USDT
• Moderate range: 0.330 – 0.406 USDT
• Expanded range: 0.324 – 0.414 USDT (One Web One Hub)
Trading within these bands reflects range-bound action unless a breakout catalyst hits.
Weekly
• ±10% range: 0.324 – 0.406 USDT
• ±20% range: 0.288 – 0.444 USDT (One Web One Hub)
Supports broader swings, allowing traders to adjust stops accordingly.
Monthly (30-Day)
• ±25% range: 0.270 – 0.460 USDT
• ±40% range: 0.220 – 0.520 USDT (One Web One Hub)
This acknowledges longer-term meme coin volatility and gives perspective on larger catalysts.
Demand & Supply Zones (Where Buy/Sell Interests Cluster)
These are zones identified by clustered reactions, volume response, and multiple-timeframe confirmation:
Demand Zones (Buy Interest):
• 0.330 – 0.345 USDT
• 0.300 – 0.320 USDT
• 0.270 – 0.290 USDT (One Web One Hub)
Supply Zones (Sell Pressure):
• 0.380 – 0.395 USDT
• 0.405 – 0.425 USDT
• 0.450 – 0.480 USDT (One Web One Hub)
These clusters represent areas where price historically encountered strong activity from buyers (demand) or sellers (supply).
Support & Resistance Levels
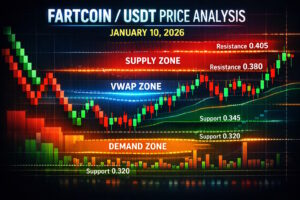
Support:
• 0.345 USDT — near-term support cluster
• 0.320 USDT — daily structural support
• 0.290 USDT — weekly support region (One Web One Hub)
Resistance:
• 0.380 USDT — immediate resistance zone
• 0.405 USDT — daily resistance
• 0.450 USDT — major resistance on broader timeframes (One Web One Hub)
Support levels are zones where buyers absorb selling pressure; resistance levels represent ceilings formed from selling pressure/history.
Sentiment Analysis
Market sentiment for FARTCOIN/USDT is currently neutral to cautiously optimistic:
• TradingView has shown mixed technicals across major timeframes with neither strong sell nor buy dominance. (TradingView)
• Social chatter around FARTCOIN remains active, though sentiment oscillates between bullish hope and bearish caution depending on short-term price moves. (Reddit)
This often characterizes meme tokens, where psychology and momentum can outweigh fundamentals.
24-Hour VWAP Zone Insight (Intraday Bias)
Though we don’t have direct VWAP indicator access here, we can intuit the 24H VWAP zone by considering where institutional liquidity and volume concentration lie based on recent price bands:
• VWAP Fair Value Approximation: ~0.355 – 0.375 USDT
This zone represents where most trades in the last 24 hours occurred — acting as dynamic support/resistance. Price above VWAP typically suggests intraday bullish bias; below suggests bearish bias.
VWAP context helps scalpers and intraday traders posture entries closer to fair value and exits around extremes.
How We Calculate These Probabilities
The methodology blends:
• Actual price range statistics (24h high/low)
• Historical volatility scaling (normal/log return assumptions)
• Multi-timeframe clustering of past reactions
• Supply/demand zone visualization
This framework is reproducible and grounded in quantitative probabilities, not arbitrary guesswork. (One Web One Hub)
Final Notes
FARTCOIN/USDT is volatile — price can swing beyond normal ranges with catalysts such as listings, social trends, or derivatives leverage flows. Always combine probability tools with risk management.
Disclaimer (Important)
This content is educational only and not financial advice. Trading and investing in cryptocurrencies carry risk and may result in loss. Always conduct your own research and consult financial professionals before making financial decisions.
Please Follow & Subscribe To One Web One Hub — Engage, Learn & Grow
2026 Jan 10 FARTCOINUSDT FI
Thank you for reading this FARTCOIN/USDT probability analysis on One Web One Hub — your go-to destination for educational crypto insights, live market contexts, and probability-based frameworks.
At One Web One Hub:
• We break down live trading data so you understand real price action.
• We explain multi-timeframe probability so even beginners can grasp key concepts.
• We provide demand/supply analysis to help you think like a market participant.
Keep coming back daily for fresh probability breakdowns, live price studies, and sentiment signals. Bookmark One Web One Hub and bring a friend — because when markets shift, preparation matters.
Engage with our content, share your thoughts, and stay connected for next-level trading clarity.
Previous Post FARTCOINUSDT – Probability Analysis for January 09, 2026
Next Post FARTCOINUSDT – Probability Analysis for January 11, 2026


