FARTCOINUSDT – Probability Analysis for December 10, 2025
FARTCOIN/USDT Price Probability Analysis — December 10, 2025
Current market snapshot (live feeds)
For clarity across exchange feeds, we use an aggregated baseline of 0.38 USDT for the range math below — this reflects recent mid-prices visible on TradingView / CoinGecko / CoinMarketCap. (TradingView)
Binance’s recent perp/spot snapshot (useful for realized range) shows a 24h high ≈ of 0.4064 USDT and a 24h low ≈ of 0.3536 USDT, which we use to estimate short-term volatility. Note: prices differ slightly across venues (Binance, Bitget, Coinbase, KuCoin, etc.), so you should check the exact price on the exchange you trade. (Binance)
What this post gives you
-
Reproducible probability bands for 1H, 4H, Daily, Weekly and Monthly horizons (percent probabilities + price ranges).
-
Clear demand & supply zones, plus support & resistance levels to plan entries/exits.
-
Short sentiment snapshot (social + volume).
-
Full “Basis of probabilities” arithmetic at the end so you can reproduce everything.
Methodology
We estimate short-term volatility from the observed 24-hour high/low (range → σ heuristic), then scale volatility for other horizons using the square-root-of-time rule (σ_t = σdaily × √t). We assume short-run log-returns are approximately normal (a simplifying, transparent assumption). The detailed arithmetic is at the end of this post.
Headline volatility numbers
• Baseline price used for bands (aggregated mid): 0.38 USDT. (TradingView)
• Binance 24h high/low (used for volatility): H = 0.4064 USDT, L = 0.3536 USDT. (Binance)
From that input, we derive an estimated daily σ ≈ 3.47% (full math at the end).
1H/4H/Daily/Weekly/Monthly — Probability bands & price ranges
Below are model probabilities (two-sided) that price stays inside ±X% for each horizon, under the model assumptions. Price bands are baseline × (1 ± X). Numbers are rounded for readability.
1H horizon — short intraday
σ1H ≈ 0.71%
• ±0.5% → Probability ≈ 51.93% → Price band: 0.37810 — 0.38190 USDT.
• ±1.0% → Probability ≈ 84.16% → Price band: 0.37620 — 0.38380 USDT.
• ±2.0% → Probability ≈ 99.52% → Price band: 0.37240 — 0.38760 USDT.
Practical use: 1H bands are for scalpers and tight intraday planning — always check order-book depth and fees on your execution venue.
4H horizon — short swing
σ4H ≈ 1.42%
• ±1.0% → Probability ≈ 68.16% → Price band: 0.37620 — 0.38380 USDT.
• ±2.0% → Probability ≈ 94.16% → Price band: 0.37240 — 0.38760 USDT.
• ±5.0% → Probability ≈ ~100.0% → Price band: 0.36100 — 0.39900 USDT.
Practical use: 4H bands are useful for multi-session swing entries; confirmation with volume reduces false signals.
Daily horizon (24 hours)
σdaily ≈ 3.47%
• ±5.0% → Probability ≈ 72.34% → Price band: 0.36100 — 0.39900 USDT.
• ±8.0% → Probability ≈ 89.03% → Price band: 0.34960 — 0.41040 USDT.
• ±10.0% → Probability ≈ 94.92% → Price band: 0.34200 — 0.41800 USDT.
Interpretation: under the current realized-range estimate, daily moves inside ±8% are reasonably likely; wider moves need a volatility spike.
Weekly horizon (next 7 days)
σweek ≈ 9.19%
• ±10.0% → Probability ≈ 72.34% → Price band: 0.34200 — 0.41800 USDT.
• ±20.0% → Probability ≈ 97.05% → Price band: 0.30400 — 0.45600 USDT.
Use weekly bands for position sizing and swing trade guardrails; watch open interest if trading futures.
Monthly horizon (next 30 days)
σmonth ≈ 19.03%
• ±25.0% → Probability ≈ 81.11% → Price band: 0.28500 — 0.47500 USDT.
• ±50.0% → Probability ≈ 99.14% → Price band: 0.19000 — 0.57000 USDT.
Monthly bands give structural guardrails — good for portfolio allocation and stop placement on longer holds.
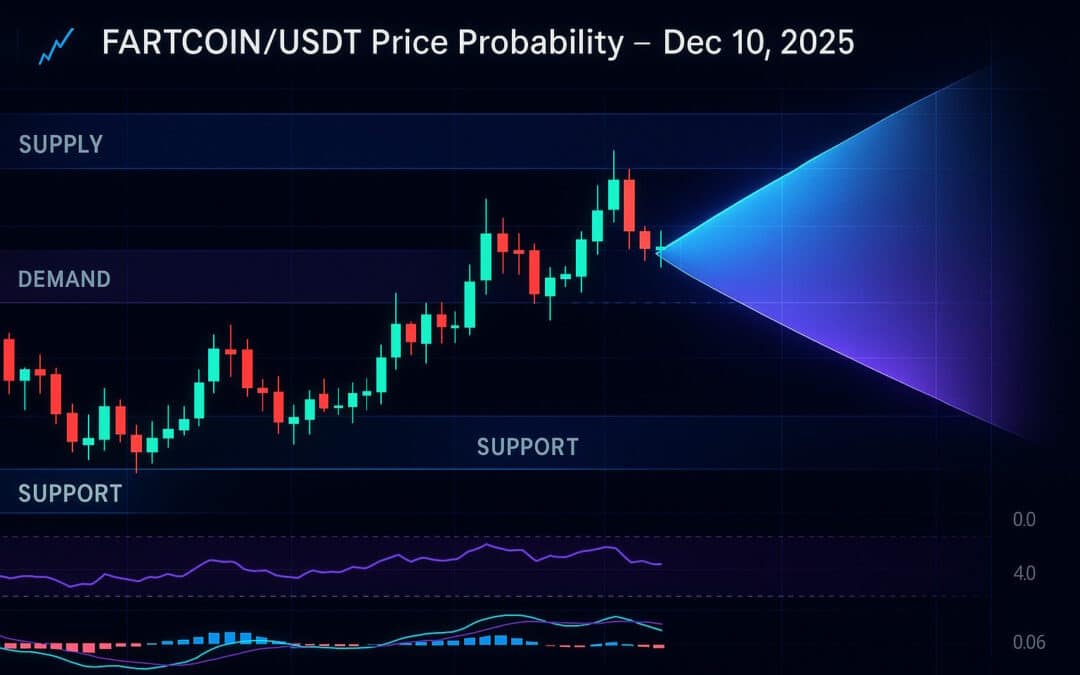
Key technical zones — Support, Resistance, Demand & Supply
(Confirm these on your exchange chart; zones are derived from recent clustering across TradingView/major exchanges.)
Immediate resistance/supply
• 0.40 — 0.41 USDT — recent upper cluster and visible profit-taking on exchange prints. (Binance)
• 0.45 — 0.60 USDT — a wider supply band that may absorb strong rallies (liquidity often thins above this region).
Immediate support/demand
• 0.35 — 0.37 USDT — short-term demand/support where buyers stepped in previously. (CoinGecko)
• 0.30 — 0.32 USDT — deeper structural support if selling intensifies or liquidity dries on major venues.
Demand zone (accumulation) to watch
• 0.33 — 0.36 USDT — watch for rising volume on dips before assuming a durable base.
Supply zone (profit-taking) to watch
• 0.39 — 0.42 USDT — repeated rejection wicks and volume spikes suggest selling pressure here.
Sentiment snapshot
• TradingView technicals show a mixed-neutral reading overall and moving averages lean slightly positive on certain short-term windows. (TradingView)
• Social chatter (X / TradingView ideas / CoinMarketCap updates) is mixed-to-cautious-bullish; some traders call for continuation while others note short-term overbought bites. (CoinMarketCap)
• Volume context: CoinGecko / CoinMarketCap show robust 24h volume — participation is healthy, which supports the usefulness of short-term ranges but also means bigger wallet flows can move price quickly. (CoinGecko)
Practical read: sentiment is cautiously constructive — combine social tone with order-book and on-chain inflow checks for higher conviction.
Trading & risk notes
• Use probability bands as planning tools, not precise predictions. If volatility rises, bands will widen quickly.
• Confirm levels on your execution venue — spot/perpetual/futures prices can differ and order-book depth matters for slippage. (Bitget)
• Size positions to tolerable risk and protect with stop-losses; consider limit orders into thin books.
Disclaimer
This content is for educational purposes only. It is not financial, investment, trading, or tax advice. The probability ranges above are model outputs under explicit assumptions (range→σ heuristic and normal-return model). Past performance does not guarantee future results. Always do your own research and apply prudent risk management.
Follow And Subscribe To One Web One Hub
If you found this transparent, reproducible analysis useful:
• Visit One Web One Hub daily — we publish multi-horizon probability briefs for scalpers, swing traders, and position holders.
• Compare daily ranges vs realized outcomes in our archive — transparency builds trust and retention.
• Download our free probability calculator & cheat-sheets to run the same model on any token in under a minute.
• Request tokens to be analyzed — we publish reader-driven reports and highlight results to keep readers returning.
“Liked this FARTCOIN brief? Read yesterday’s analysis to compare how our ranges tracked the market. Subscribe for daily probability briefs and request the next token you want analyzed — One Web One Hub gives repeatable, trade-aware insights, not guesswork.”
Basis of probabilities
(Use these exact steps to reproduce the numbers above.)
-
Live high/low inputs (Binance snapshot):
• H = 0.4064 USDT. (Binance)
• L = 0.3536 USDT. (Binance) -
Full observed 24h absolute range = H − L = 0.4064 − 0.3536 = 0.0528 USDT.
-
Midpoint = (H + L) / 2 = (0.4064 + 0.3536) / 2 = 0.3800 USDT.
-
Relative 24h range = FullRange / Midpoint = 0.0528 / 0.38 ≈ 0.13947 = 13.947%.
-
Heuristic conversion to daily standard deviation (σdaily): assume full 24h range ≈ 4 × σdaily (common quick rule).
→ σdaily ≈ relative_range / 4 ≈ 0.13947 / 4 ≈ 0.03487 = 3.487% (we rounded to ≈3.47% in the post). -
Scale to other horizons using square-root-of-time:
• σ1H = σdaily / √24 ≈ 0.03487 / 4.899 ≈ 0.00709 = 0.709%.
• σ4H = σdaily / √6 ≈ 0.03487 / 2.449 ≈ 0.01418 = 1.418%.
• σweek = σdaily × √7 ≈ 0.03487 × 2.646 ≈ 0.09191 = 9.191%.
• σmonth = σdaily × √30 ≈ 0.03487 × 5.477 ≈ 0.19026 = 19.026%. -
For a chosen band ±X (e.g., ±0.05 for ±5%), compute the two-sided probability under a zero-mean normal model:
Probability = 2 × Φ( X / σ_horizon ) − 1 = erf( X / (σ_horizon × √2) ).
Where Φ is the standard normal CDF and erf is the error function. -
Price band = baseline × (1 ± X). Example: daily ±5% band → lower = 0.38 × 0.95 = 0.3610; upper = 0.38 × 1.05 = 0.3990.
Sources/live pages checked
2025 Dec 10 FARTCOINUSDT FI
• TradingView — FARTCOIN/USDT symbol & market pages. (TradingView)
• Binance — FARTCOINUSDT perp/spot 24h high & low (used for volatility input). (Binance)
• CoinGecko — live price and volume snapshots. (CoinGecko)
• CoinMarketCap — price & market context. (CoinMarketCap)
Previous Post FARTCOINUSDT – Probability Analysis for December 09, 2025
Next Post FARTCOINUSDT – Probability Analysis for December 11, 2025


