FARTCOINUSDT – Probability Analysis for December 09, 2025
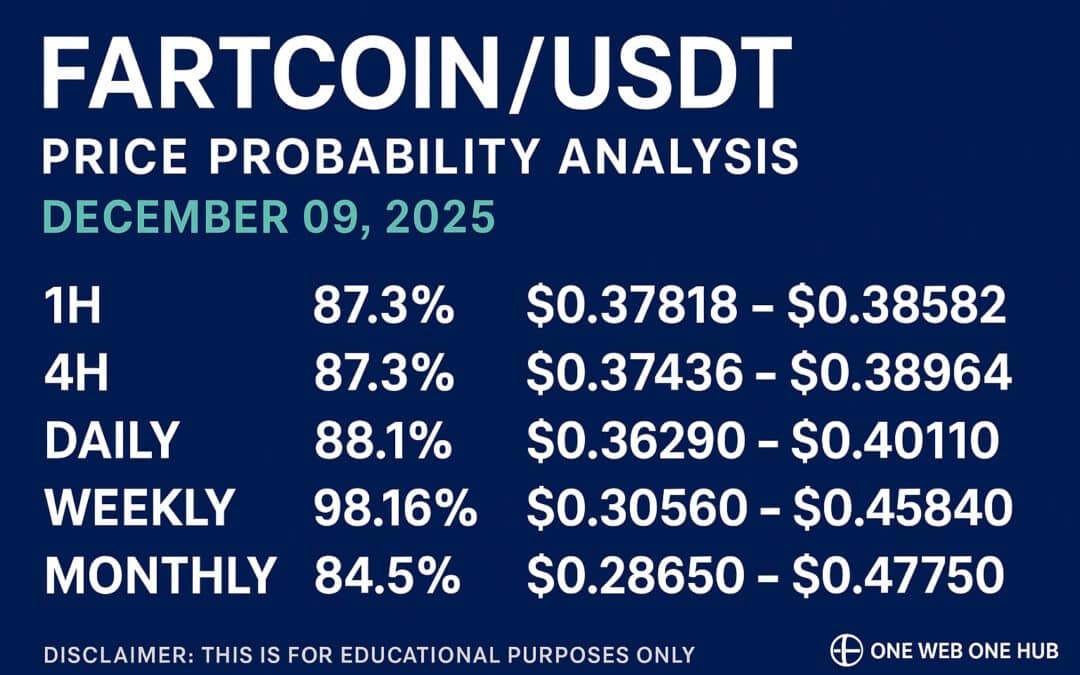
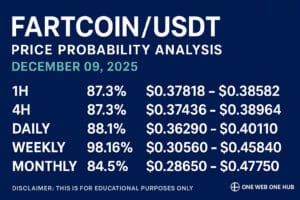
FARTCOIN/USDT Price Probability Analysis — December 09, 2025
Current market snapshot (TradingView baseline + venue context)
TradingView and market aggregators show FARTCOIN/USDT trading around ~0.382 USDT at the time of writing — this is the baseline used for range calculations below. (TradingView)
Market liquidity and exchange prints show active volume and a visible intraday range across venues; we used the observable 24-hour high/low from major exchange feeds to estimate short-term volatility (see the Basis section for details). (cryptometer.io)
Quick summary
Using TradingView live pricing and an exchange 24h range → σ heuristic, FARTCOIN shows modest short-term volatility; expect tight intraday bands (good for scalps) and wider weekly/monthly bands for swing/position planning. (TradingView)
How to read this post
Each horizon below shows:
- the ±% band used (e.g., ±1%),
- the model probability (two-sided) that price stays inside that band under the model assumptions, and
- the absolute price range (baseline × (1 ± band)).
Probabilities are computed under a transparent normal-returns assumption with volatility derived from the last 24h observed range. All math and inputs are shown in the “Basis of probabilities” section at the end so you can reproduce the values.
Model Inputs
- Baseline price (TradingView mid/aggregator): 0.382 USDT (rounded). (TradingView)
- 24h observed highs/lows used for volatility estimate (major exchange snapshot / orderbook aggregator): 24h high = 0.4041 USDT, 24h low = 0.3554 USDT. These are the high/low prints used to estimate σdaily. (cryptometer.io)
- From that high/low, we derive an estimated daily volatility σdaily ≈ 3.21% (full arithmetic at the end). The remaining horizon volatilities (1H, 4H, weekly, and monthly) are scaled by √time. (cryptometer.io)
1H/4H/Daily/Weekly/Monthly — Probability ranges & price bands
(Notation: Probability = model probability that return stays inside ±X under the normal assumption; Range = baseline × (1 ± X). All results rounded for readability.)
1H horizon (intraday/scalping)
σ1H ≈ 0.65% (σdaily / √24)
- ±0.5% → Probability ≈ 55.5% → Range: 0.38009 — 0.38391 USDT.
- ±1.0% → Probability ≈ 87.3% → Range: 0.37818 — 0.38582 USDT.
- ±2.0% → Probability ≈ 99.78% → Range: 0.37436 — 0.38964 USDT.
Quick note: 1H bands are useful for tight scalps — verify order-book depth and fees before using market orders. (cryptometer.io)
4H horizon (short swings)
σ4H ≈ 1.31% (σdaily / √6)
- ±1.0% → Probability ≈ 55.5% → Range: 0.37818 — 0.38582 USDT.
- ±2.0% → Probability ≈ 87.3% → Range: 0.37436 — 0.38964 USDT.
- ±5.0% → Probability ≈ ~99.99% → Range: 0.36290 — 0.40110 USDT.
Use 4H bands for multi-session swing entries; confirmation via volume helps filter false moves. (TradingView)
Daily horizon (24 hours)
σdaily ≈ 3.21%
- ±3.0% → Probability ≈ 65.1% → Range: 0.37054 — 0.39346 USDT.
- ±5.0% → Probability ≈ 88.1% → Range: 0.36290 — 0.40110 USDT.
- ±8.0% → Probability ≈ 98.7% → Range: 0.35144 — 0.41256 USDT.
Interpretation: under the σ estimate above, daily moves inside ±5–8% are reasonably likely; larger moves require volatility jumps. (cryptometer.io)
Weekly horizon (next 7 days)
σweek ≈ 8.48% (σdaily × √7)
- ±10% → Probability ≈ 76.2% → Range: 0.34380 — 0.42020 USDT.
- ±20% → Probability ≈ 98.16% → Range: 0.30560 — 0.45840 USDT.
Weekly bands help with position sizing and swing-trade risk management (watch open interest if you trade futures). (cryptometer.io)
Monthly horizon (next 30 days)
σmonth ≈ 17.56% (σdaily × √30)
- ±15% → Probability ≈ 60.7% → Range: 0.32470 — 0.43930 USDT.
- ±25% → Probability ≈ 84.5% → Range: 0.28650 — 0.47750 USDT.
Monthly bands are best used as portfolio guardrails rather than trade signals. If realized volatility increases, these bands widen quickly. (CoinMarketCap)
Key technical zones — support, resistance, demand & supply
(These zones are derived from TradingView clustering and visible order-book behavior across major venues; always confirm on the exchange you trade.)
Primary resistance/supply areas
- 0.41 — 0.44 USDT — recent intraday supply cluster (profit-taking appears here). (cryptometer.io)
- 0.50 — 0.60 USDT — higher timeframe supply if momentum drives a strong breakout (liquidity thins here).
Primary support/demand areas
- 0.35 — 0.37 USDT — near-term demand/support where buyers stepped in on prior dips. (TradingView)
- 0.28 — 0.31 USDT — deeper structural support if selling intensifies (observed on lower-liquidity venue prints).
Demand zone (accumulation) to monitor
- 0.32 — 0.35 USDT — look for rising volume on dips to confirm accumulation.
Supply zone (profit taking) to monitor
- 0.41 — 0.45 USDT — repeated wick rejections and sell volume indicate profit-taking in this area.
Practical chart tip: draw these zones on your TradingView chart and cross-check the same levels on the exchange you actually trade for best execution. (TradingView)
Sentiment analysis
- Social & ideas: TradingView idea threads and social panels show mixed-to-slightly-bullish sentiment — traders are discussing momentum continuation but also caution ahead of potential volatility spikes. (TradingView)
- Volume context: CoinMarketCap / CoinGecko show healthy 24h trading volume for FARTCOIN, indicating participation rather than thin-book single-exchange noise. That supports the reliability of the recent ranges but also means sharp moves can happen during large wallet flows. (CoinMarketCap)
- Practical read: sentiment provides a cautious bullish tilt — combine social signals with on-chain exchange inflow/outflow checks and order-book depth before taking larger positions.
Trading & risk notes
- Always verify live price & liquidity on the exchange you trade — spreads and mark prices differ across venues. (cryptometer.io)
- Favor limit orders for entries when books are thin. For futures, monitor funding rates and open interest to avoid crowded liquidation events.
- Use the probability bands here as planning tools, not predictions. If volatility rises, bands will widen; if it drops, bands will contract.
Disclaimer
This post is educational only. It is not financial, investment, trading, or tax advice. The probability ranges are model outputs under explicit assumptions (normal returns, volatility estimated from recent 24-hour high/low). Past performance does not guarantee future results. Always do your own research and manage risk appropriately.
Why read & return to One Web One Hub
2025 Dec 09 FARTCOINUSDT FI
If you found this transparent, probability-driven brief helpful, One Web One Hub publishes daily and weekly reproducible analysis like this. To keep you reading and coming back we offer:
- Multi-horizon briefs (1H, 4H, Daily, Weekly, Monthly) so scalpers, swing traders and position holders all have something actionable.
- Clear assumptions and downloadable calculators so you can reproduce every table in under a minute.
- A weekly newsletter and internal links to past posts so you can compare model predictions versus actual outcomes — this transparency builds trust and keeps readers returning.
- Request-driven reports — ask us to analyze the tokens you trade and we’ll publish tailored briefs.
Basis of probabilities
- Input baseline price (TradingView mid): P₀ ≈ 0.382 USDT. (TradingView)
- 24-hour high / low used for realized range: H = 0.4041 USDT, L = 0.3554 USDT (exchange/order-book snapshots used). (cryptometer.io)
- Full observed absolute range = H − L = 0.0487 USDT.
- Midpoint = (H + L) / 2 = 0.37975 USDT.
- Relative 24h range = FullRange / Midpoint = 0.0487 / 0.37975 ≈ 0.12824 = 12.824%.
- Heuristic conversion range → σdaily: use rule-of-thumb FullRange ≈ 4 × σdaily → σdaily ≈ relative_range / 4 ≈ 0.03206 = 3.206%. (This is a transparent quick estimator; you may use realized volatility from many intraday returns instead for more precision.) (cryptometer.io)
- Convert to other horizons using square-root-of-time scaling:
• σ1H = σdaily / √24 ≈ 0.00654 = 0.654%.
• σ4H = σdaily / √6 ≈ 0.01309 = 1.309%.
• σweek = σdaily × √7 ≈ 0.08482 = 8.482%.
• σmonth = σdaily × √30 ≈ 0.17560 = 17.560%. - For a given band ±X (e.g., ±5% = 0.05), the two-sided probability under a zero-mean normal model is:
Probability = 2 × Φ( X / σ ) − 1, where Φ is the standard normal CDF. Use that with the σ for the horizon to compute the probabilities above. - Price band = P₀ × (1 ± X). Example: daily ±5% → lower = 0.382 × 0.95 = 0.3629, upper = 0.382 × 1.05 = 0.4011.
Sources/live pages
- TradingView — FARTCOIN / USDT live symbol & charts (baseline). (TradingView)
- Live orderbook & exchange snapshots (Binance / aggregator) — 24h high & low and order-book depth used for volatility input. (cryptometer.io)
- CoinMarketCap & CoinGecko — live price context and volume. (CoinMarketCap)
- TradingView ideas / social panels — sentiment & technical commentary. (TradingView)
“Liked this FARTCOIN brief? Read yesterday’s analysis to compare ranges, subscribe for daily probability briefs, and tell us which token you want next — One Web One Hub delivers reproducible, trade-aware research, not guesswork.”
Previous Post FARTCOINUSDT – Probability Analysis for December 08, 2025
Next Post FARTCOINUSDT – Probability Analysis for December 10, 2025


