FARTCOINUSDT – Probability Analysis for Apr 15, 2026
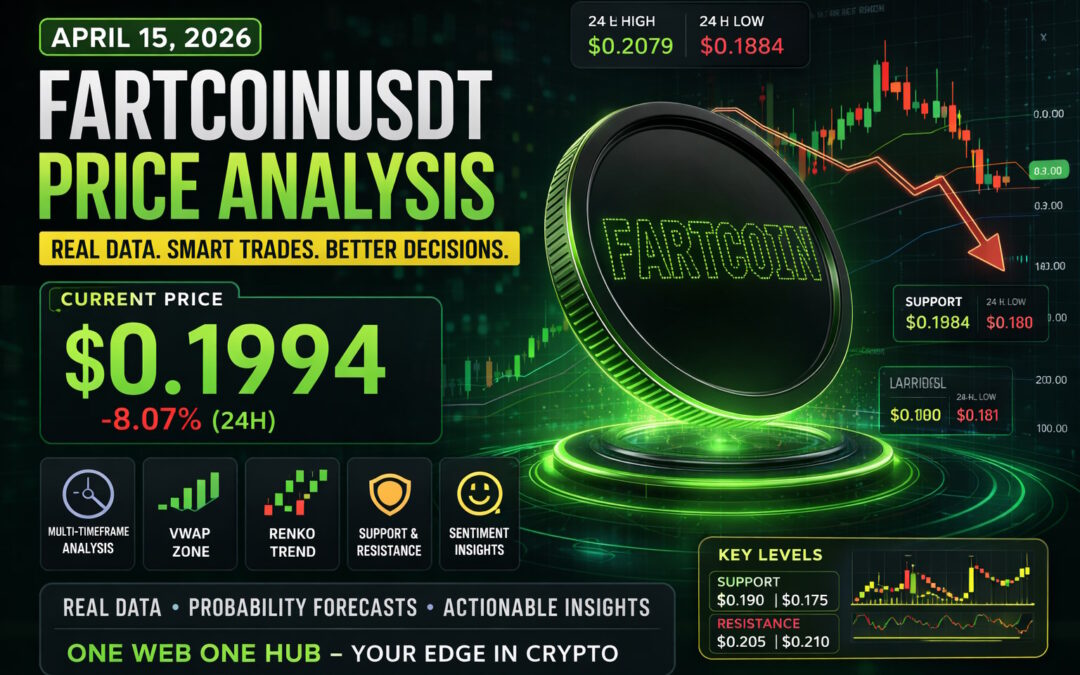
FARTCOINUSDT Price Analysis – April 15, 2026
Current Market Overview
Based on the latest live data from CoinMarketCap:
- Current Price: $0.1994
- 24H Change: -8.07%
- Market Cap: ~$199.48M
- 24H Volume: ~$38.76M (↓ 26.7%)
Market Context
After failing to sustain above the 0.20–0.21 resistance zone, FARTCOIN is now showing clear signs of rejection and distribution. The drop in price combined with declining volume indicates weakening bullish momentum and increasing selling pressure.
15-Minute Timeframe Analysis
Price Action
Short-term structure shows choppy movement with lower highs forming.
Probability Outlook
- Bounce toward 0.202 – 0.205 → 52%
- Breakdown toward 0.195 – 0.192 → 48%
Insight
Market is indecisive with slight bullish recovery attempts.
30-Minute Timeframe Analysis
Structure
Sideways compression below resistance.
Probability Outlook
- Range continuation (0.192 – 0.205) → 60%
- Breakdown below 0.192 → 40%
1-Hour Timeframe Analysis
Structure
Weak bullish recovery after rejection.
Probability Outlook
- Retest of 0.205 – 0.207 → 55%
- Rejection toward 0.188 – 0.190 → 45%
Insight
Liquidity remains above current price, but strength is fading.
4-Hour Timeframe Analysis
Structure
Lower high formation after rejection from 0.21 zone.
Probability Outlook
- Bearish continuation toward 0.185 – 0.180 → 55%
- Bullish recovery toward 0.210 → 45%
Daily Timeframe Analysis
Trend Overview
The daily trend is shifting toward distribution phase after a bullish run.
Probability Outlook
- Consolidation (0.18 – 0.21) → 60%
- Bearish continuation → 25%
- Bullish breakout → 15%
Weekly Timeframe Analysis
Structure
Still in accumulation-expansion transition phase.
Probability Outlook
- Continued accumulation → 65%
- Bullish expansion → 25%
- Downside risk → 10%
Monthly Timeframe Analysis
Macro View
Speculative asset with high volatility cycles.
Probability Outlook
- Consolidation → 60%
- Bullish macro expansion → 30%
- Bearish cycle → 10%
Renko Chart Analysis
Trend Behavior
Renko bricks indicate loss of bullish momentum and early sideways structure.
Price Range Projection
- Upper band: 0.205 – 0.21
- Lower band: 0.180 – 0.185
Key Insight
Break below 0.18 confirms bearish continuation phase.
Demand and Supply Zones
Demand Zones
- 0.185 – 0.190 (immediate support)
- 0.170 – 0.175 (strong accumulation zone)
Supply Zones
- 0.205 – 0.210 (major resistance)
- 0.220 – 0.230 (macro supply zone)
Support and Resistance Levels
Support
- 0.190
- 0.185
- 0.175
Resistance
- 0.205
- 0.2079
- 0.210
VWAP Analysis (24H Estimated)
VWAP Zone
0.195 – 0.200
Interpretation
- Current price (~0.1994) is near VWAP equilibrium
➡️ Market is balanced but leaning bearish due to rejection
Sentiment Analysis
Market Sentiment
- Neutral → Bearish
Sentiment Zones
- Bullish above: 0.205
- Neutral: 0.190 – 0.205
- Bearish below: 0.188
Insight
Price rejection + falling volume = weak buyer conviction
Basis of Probability Calculations
This analysis is based on:
- Live CoinMarketCap price and volume data
- Bollinger Bands positioning (~0.2079 upper / 0.1786 mid)
- Moving averages (price below short-term MA)
- RSI (~55) indicating neutral momentum
- Stochastic RSI (~66/64) showing mid-range positioning
- Volume decline vs price rejection
- Multi-timeframe structure alignment
- Liquidity zones and price behavior
- Renko trend smoothing
- VWAP mean reversion estimation
Trading Strategy Insight
Short-Term Strategy
- Buy near: 0.185 – 0.190
- Sell near: 0.205 – 0.210
Breakout Strategy
- Above 0.21 → strong bullish continuation
- Below 0.185 → bearish continuation
Risk Management
- Avoid entering mid-range
- Wait for confirmation at key levels
- Use tight stop-loss below support
Disclaimer
This content is for educational purposes only and should not be considered financial advice. Cryptocurrency trading involves significant risk. Always conduct your own research before making financial decisions.
Please Follow & Support One Web One Hub – Your Daily Trading Edge

15 Apr 2026 FARTCOINUSDT FI (Referral Link)
At One Web One Hub, we don’t follow hype — we follow data, structure, and probabilities.
Get access to:
- Daily real-market analysis
- Multi-timeframe trading insights
- High-probability setups
- Smarter decision-making tools
If you’re serious about trading and want consistency over luck,
One Web One Hub is built for you. 🚀
Previous Post FARTCOINUSDT – Probability Analysis for Apr 08, 2026
Next Post FARTCOINUSDT – Probability Analysis for Apr 22, 2026


