FARTCOINUSDT – Probability Analysis for Apr 08, 2026
FARTCOINUSDT Price Analysis – April 08, 2026
Current Market Overview
Live Price Snapshot
Based on the latest visible data from CoinMarketCap:
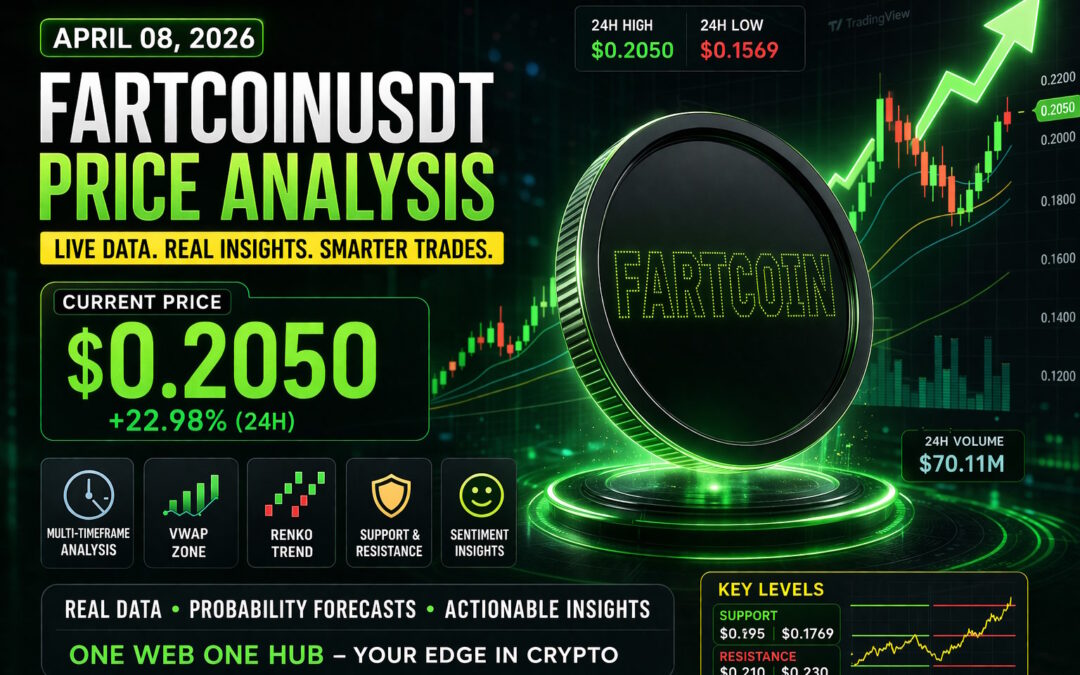
- Current Price: $0.2050
- 24H Change: +22.98%
- Market Cap: ~$205M
- 24H Volume: ~$70M
Market Context
FARTCOIN has entered a high-momentum breakout phase, transitioning from consolidation into aggressive bullish expansion. Volume expansion confirms strong participation, but indicators suggest approaching short-term overheating.
15-Minute Timeframe Analysis
Price Action
Strong breakout followed by micro consolidation near highs.
Probability Outlook
- Continuation toward 0.210 – 0.215 → 65%
- Pullback toward 0.195 – 0.198 → 35%
Insight
Short-term momentum remains bullish, but overbought conditions are forming.
30-Minute Timeframe Analysis
Structure
Higher highs and higher lows forming.
Probability Outlook
- Bullish continuation → 60%
- Range consolidation (0.195 – 0.210) → 30%
- Sharp correction → 10%
1-Hour Timeframe Analysis
Structure
Breakout from prior range confirmed with volume spike.
Probability Outlook
- Extension toward 0.22 – 0.235 → 60%
- Pullback retest 0.19 – 0.195 → 40%
Insight
Healthy uptrend, but requires consolidation to sustain move.
4-Hour Timeframe Analysis
Structure
Trend reversal confirmed (bullish shift).
Probability Outlook
- Continuation toward 0.24 – 0.26 → 55%
- Range formation → 30%
- Reversal below 0.18 → 15%
Daily Timeframe Analysis
Trend Overview
Daily structure shows breakout from accumulation base.
Probability Outlook
- Bullish continuation → 50%
- Consolidation (0.18 – 0.24) → 35%
- Bearish rejection → 15%
Weekly Timeframe Analysis
Structure
Early-stage expansion after accumulation.
Probability Outlook
- Expansion toward 0.28 – 0.35 → 45%
- Continued accumulation → 40%
- Downside risk → 15%
Monthly Timeframe Analysis
Macro View
Highly speculative but trending toward bullish cycle.
Probability Outlook
- Bullish macro expansion → 50%
- Volatile consolidation → 35%
- Major downside → 15%
Renko Chart Analysis
Trend Behavior
Renko bricks show clear bullish continuation with minimal reversals, indicating strong directional bias.
Price Range Projection
- Bullish zone: 0.205 – 0.26
- Support floor: 0.18 – 0.19
Key Signal
No major bearish reversal bricks yet → trend remains intact.
Demand and Supply Zones
Demand Zones
- 0.185 – 0.195 (fresh breakout retest zone)
- 0.155 – 0.170 (strong historical base)
Supply Zones
- 0.22 – 0.24 (short-term resistance)
- 0.26 – 0.30 (major rejection zone)
Support and Resistance Levels
Support
- 0.195
- 0.1769
Resistance
- 0.210
- 0.230
VWAP Analysis (24H Estimated)
VWAP Zone
- Estimated VWAP: 0.190 – 0.198
Interpretation
- Current price (0.2050) is above VWAP
➡️ Indicates bullish control, but also signals premium pricing zone
Sentiment Analysis
Market Sentiment
- Strong bullish (short-term)
- Cautious optimism (mid-term)
Sentiment Price Zones
- Bullish above: 0.200
- Neutral: 0.185 – 0.200
- Bearish below: 0.180
Insight
Retail momentum is increasing → risk of FOMO-driven spikes followed by volatility.
Basis of Probability Calculations
This analysis integrates:
- Live CoinMarketCap price and volume data
- TradingView chart structure and indicators
- Bollinger Bands expansion
- Stochastic RSI overbought signals (visible ~77 level)
- Moving average positioning
- Volume breakout confirmation
- Market cycle psychology
- Renko trend smoothing
- VWAP mean positioning (estimated)
Trading Strategy Insight
Short-Term Strategy
- Buy dips near: 0.195 – 0.200
- Target: 0.22 – 0.24
Breakout Strategy
- Above 0.21 → continuation toward 0.24+
Risk Management
- Watch for fake breakout above 0.21
- Avoid chasing extended candles
Disclaimer
This content is for educational purposes only and should not be considered financial advice. Cryptocurrency markets are highly volatile and risky. Always conduct your own research before making any financial decisions.
Please Follow & Support Us At One Web One Hub – Your Edge in Crypto

08 Apr 2026 FARTCOINUSDT FI (Referral Link)
At One Web One Hub, we transform raw data into actionable intelligence.
If you want:
- Clear probability-based trading insights
- Multi-timeframe breakdowns
- Real market structure understanding
- Consistent edge in volatile markets
Then you’re exactly where you need to be.
Stay ahead of the crowd.
Stay informed.
Stay profitable.
Visit One Web One Hub daily and turn insights into results.
Previous Post FARTCOINUSDT – Probability Analysis for Apr 01, 2026
Next Post FARTCOINUSDT – Probability Analysis for Apr 15, 2026


