BITCOINUSDT – Probability Analysis for May 01, 2026
Bitcoin (BTC/USDT) Price Analysis – May 01, 2026
Live BTC Market Snapshot
Based on the latest data from CoinMarketCap and chart structure:
-
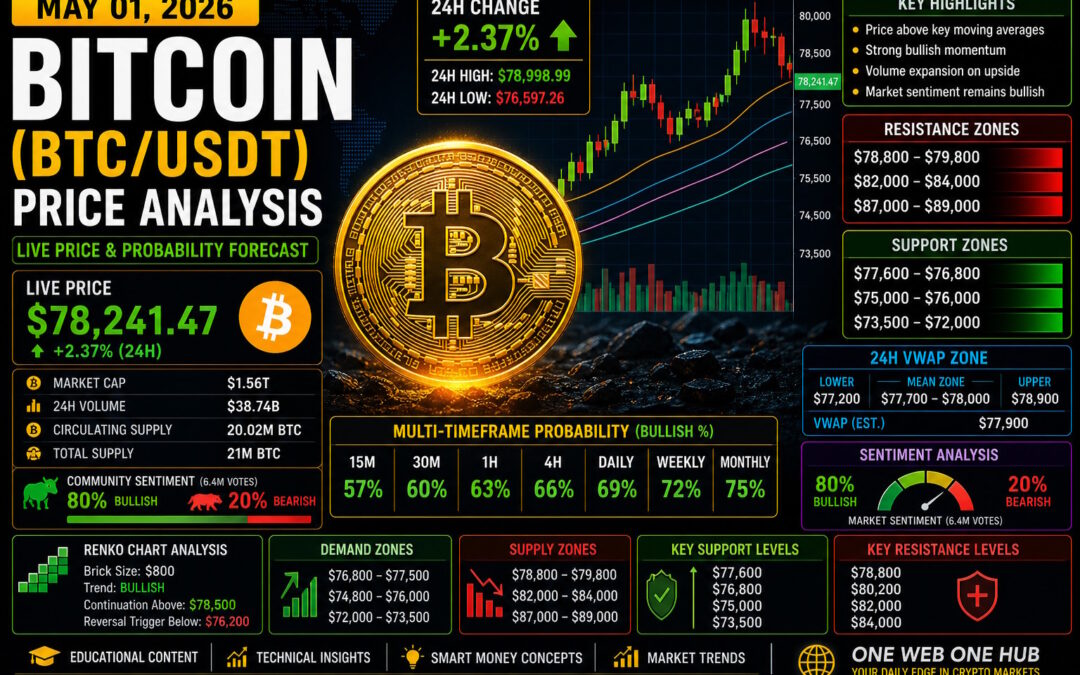
Live Price: $78,241.47
-
24H Change: +2.37%
-
Market Cap: $1.56T
-
24H Volume: $38.74B
-
Community Sentiment: 80% Bullish / 20% Bearish
Bitcoin is showing renewed bullish momentum, reclaiming higher levels after consolidation.
Market Structure Overview
BTC has formed a strong impulsive move followed by a healthy pullback, indicating continuation potential.
Key Observations
-
Price holding above key moving averages
-
Higher highs forming on intraday structure
-
Volume expansion during upward move
-
Bullish sentiment remains dominant
Methodology Behind Probability Analysis
Core Inputs Used
Technical Structure
-
Candlestick behavior from chart
-
RSI (~60 zone, bullish strength)
-
Bollinger Band expansion
-
Moving average alignment (price above mid bands)
Order Flow & Behavior
-
Liquidity pools above $78.5K–$80K
-
Stop-loss clusters below $77K
-
Sentiment skew (80% bullish)
Probability Logic
-
50% = neutral
-
60%+ = directional edge
-
70%+ = strong continuation bias
Multi-Timeframe BTC Price Probability
15-Minute Timeframe
Bias: Short-Term Bullish Continuation
-
Bullish Probability: 57%
-
Bearish Probability: 43%
Expected Range
-
Upside: $78,800
-
Downside: $77,600
Insight
Momentum favors quick upside scalps while above intraday VWAP.
30-Minute Timeframe
Bias: Bullish Structure
-
Bullish Probability: 60%
-
Bearish Probability: 40%
Expected Range
-
Upside: $79,200
-
Pullback: $77,300
Insight
Price consolidating before potential breakout.
1-Hour Timeframe
Bias: Breakout Formation
-
Bullish Probability: 63%
-
Bearish Probability: 37%
Expected Range
-
Target: $80,200
-
Support: $77,000
Insight
Higher highs + higher lows intact.
4-Hour Timeframe
Bias: Strong Bullish Trend
-
Bullish Probability: 66%
-
Bearish Probability: 34%
Expected Range
-
Upside: $82,000
-
Pullback: $76,200
Insight
Trend continuation likely unless key support breaks.
Daily Timeframe
Bias: Bullish Expansion
-
Bullish Probability: 69%
-
Bearish Probability: 31%
Expected Range
-
Resistance: $84,000
-
Support: $75,000
Insight
Daily structure supports continuation toward macro highs.
Weekly Timeframe
Bias: Macro Bullish
-
Bullish Probability: 72%
-
Bearish Probability: 28%
Expected Range
-
Upside: $88,000
-
Support: $72,000
Insight
Institutional accumulation still active.
Monthly Timeframe
Bias: Cycle Continuation
-
Bullish Probability: 75%
-
Bearish Probability: 25%
Expected Range
-
Bull Case: $95,000+
-
Bear Case: $68,000
Insight
Bitcoin remains in long-term expansion phase.
Renko Chart Analysis
Estimated Brick Size: $800
Trend Structure
-
Strong bullish brick sequence
-
Minor pause after impulse move
-
No confirmed reversal pattern
Key Renko Levels
-
Bull Continuation Above: $78,500
-
Expansion Zone: $80,000
-
Reversal Trigger: $76,200
Insight
Renko confirms trend strength unless sharp downside occurs.
Demand Zones
Institutional Buying Areas
Primary Demand
-
$76,800 – $77,500
Secondary Demand
-
$74,800 – $76,000
Deep Demand
-
$72,000 – $73,500
Supply Zones
Selling Pressure Areas
Immediate Supply
-
$78,800 – $79,800
Major Supply
-
$82,000 – $84,000
Extended Supply
-
$87,000 – $89,000
Support & Resistance Levels
Support
-
$77,600
-
$76,800
-
$75,000
-
$73,500
Resistance
-
$78,800
-
$80,200
-
$82,000
-
$84,000
VWAP Analysis
Estimated Session VWAP
-
VWAP Mean: $77,900
Interpretation
-
Price above VWAP → bullish control
-
Pullbacks to VWAP → buying opportunities
-
Strong acceptance above VWAP = continuation signal
24H VWAP Zone
Estimated Fair Value Range
-
Lower Band: $77,200
-
Mean Zone: $77,700 – $78,000
-
Upper Band: $78,900
Insight
Price trading above mean zone confirms bullish intraday sentiment.
Sentiment Analysis
Market Sentiment
-
80% Bullish
-
20% Bearish
Interpretation
Strong optimism supports trend continuation, but also increases risk of short-term corrections.
Sentiment Price Levels
-
Bullish Continuation Above: $78,800
-
Neutral Zone: $77,000 – $78,800
-
Bearish Breakdown Below: $76,800
Smart Money & Liquidity Zones
Upside Liquidity Targets
-
$79,000
-
$80,000
-
$82,000
Downside Liquidity Pools
-
$77,000
-
$76,200
-
$75,500
Expect volatility spikes near these zones.
Trading Insights (Educational)
Conservative Strategy
Wait for breakout above resistance or bounce from demand zones.
Aggressive Strategy
Trade momentum with tight risk management.
Risk Reminder
Avoid overtrading during consolidation phases.
Disclaimer
This content is for educational purposes only and does not constitute financial advice. Cryptocurrency markets are highly volatile. Always perform your own research and consult a financial advisor before making investment decisions.
Grow with One Web One Hub
01 May 2026 BITCOINUSDT FI (Referral Link)
Your Daily Edge in Crypto Markets
At One Web One Hub, we deliver:
-
Daily Bitcoin analysis
-
Smart money concepts simplified
-
Multi-timeframe forecasts
-
Real market insights that matter
Why Stay Connected?
Because informed traders make better decisions.
Make One Web One Hub your daily habit and stay ahead in the crypto market with insights designed to educate, engage, and empower.
Previous Post BITCOINUSDT – Probability Analysis for Apr 24, 2026
Next Post BITCOINUSDT – Probability Analysis for May 08, 2026


