BITCOINUSDT – Probability Analysis for Apr 24, 2026
Bitcoin (BTC/USDT) Price Analysis – April 24, 2026
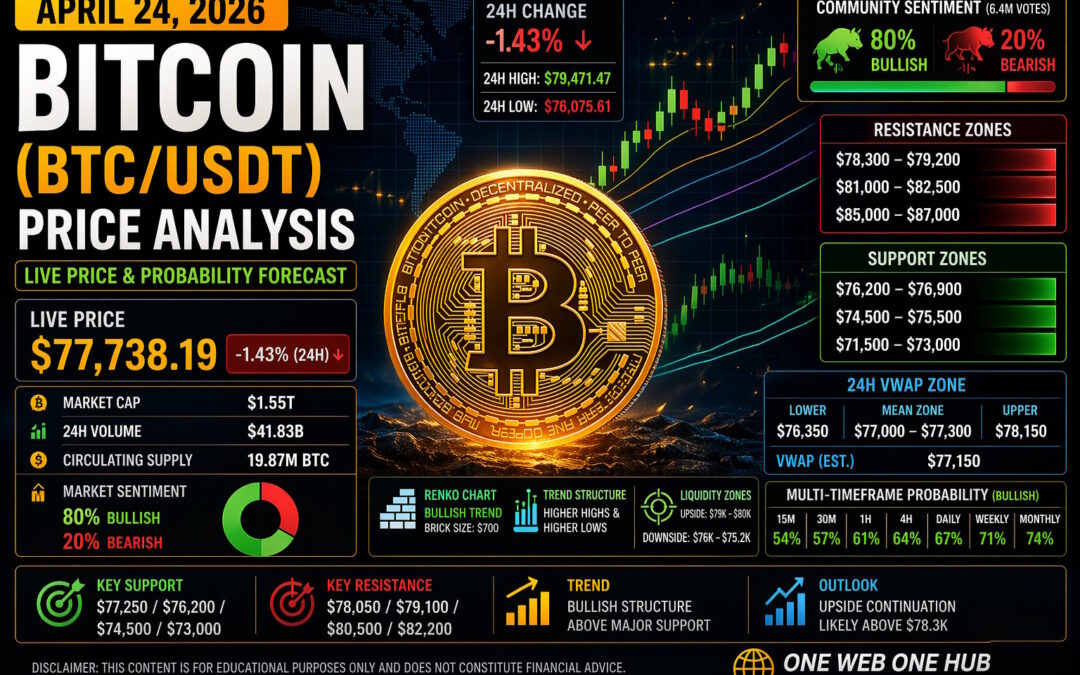
Live BTC Market Snapshot
Based on the provided CoinMarketCap market screenshot, Bitcoin (BTC) is currently trading near:
-
Live Price: $77,738.19
-
24H Change: -1.43%
-
Market Cap: $1.55T
-
24H Volume: $41.83B
-
Community Sentiment: 80% Bullish / 20% Bearish
Bitcoin remains elevated despite mild intraday weakness, signaling that the broader bullish trend is still intact while short-term profit-taking occurs.
Current Market Overview
BTC is consolidating beneath resistance after a strong upside move earlier in the month. Price remains above key moving averages while volume cools slightly, often a sign of pause before the next directional move.
Key Market Signals
-
Mild pullback after recent rally
-
Price still above major support zones
-
Community sentiment strongly bullish
-
Momentum cooling but not broken
-
Range expansion possible soon
Methodology Behind This Analysis
Probability Inputs Used
Technical Data
-
Price action from chart structure
-
RSI & Stochastic RSI positioning
-
Bollinger Band behavior
-
Moving average alignment
-
Intraday momentum shifts
Flow Data
-
Volume contraction/expansion
-
Crowd sentiment skew
-
Liquidity zones above/below price
-
Historical BTC reaction patterns
Probability Logic
-
50% = neutral
-
60%+ = directional advantage
-
70%+ = strong continuation odds
Multi-Timeframe BTC Probability Analysis
15-Minute Timeframe
Bias: Short-Term Range Bullish
-
Bullish Probability: 54%
-
Bearish Probability: 46%
Expected Range
-
Upside: $78,050
-
Downside: $77,250
Insight
Fast scalping range while market seeks direction.
30-Minute Timeframe
Bias: Recovery Attempt
-
Bullish Probability: 57%
-
Bearish Probability: 43%
Expected Range
-
Upside: $78,420
-
Pullback: $76,980
Insight
Holding above session support keeps bulls active.
1-Hour Timeframe
Bias: Controlled Bullish Structure
-
Bullish Probability: 61%
-
Bearish Probability: 39%
Expected Range
-
Target: $79,100
-
Support Retest: $76,800
Insight
Higher lows still visible on chart.
4-Hour Timeframe
Bias: Consolidation Before Expansion
-
Bullish Probability: 64%
-
Bearish Probability: 36%
Expected Range
-
Upside: $80,500
-
Pullback: $75,900
Insight
Trend remains healthy unless $75.9K fails.
Daily Timeframe
Bias: Bullish Continuation
-
Bullish Probability: 67%
-
Bearish Probability: 33%
Expected Range
-
Resistance: $82,200
-
Support: $74,500
Insight
Daily chart favors buyers while above mid-range supports.
Weekly Timeframe
Bias: Macro Bullish
-
Bullish Probability: 71%
-
Bearish Probability: 29%
Expected Range
-
Upside: $86,000
-
Support: $71,000
Insight
Weekly structure still points higher unless macro reversal occurs.
Monthly Timeframe
Bias: Cycle Strength
-
Bullish Probability: 74%
-
Bearish Probability: 26%
Expected Range
-
Bull Case: $92,000+
-
Bear Case: $68,000
Insight
Bitcoin remains in long-cycle expansion territory.
Renko Chart Analysis
Estimated Brick Size: $700
Current Trend State
-
Bullish bricks dominate structure
-
Short pause after upside sequence
-
No confirmed bearish reversal yet
Renko Price Zones
-
Bull Continuation Above: $78,200
-
Expansion Trigger Above: $79,400
-
Reversal Trigger Below: $75,800
Insight
Renko remains constructive while above $75.8K.
Demand Zones
Institutional Buy Interest
Primary Demand
-
$76,200 – $76,900
Secondary Demand
-
$74,500 – $75,500
Deep Demand
-
$71,500 – $73,000
Supply Zones
Seller Pressure Areas
Immediate Supply
-
$78,300 – $79,200
Major Supply
-
$81,000 – $82,500
Extended Supply
-
$85,000 – $87,000
Support & Resistance Levels
Support
-
$77,250
-
$76,200
-
$74,500
-
$73,000
Resistance
-
$78,050
-
$79,100
-
$80,500
-
$82,200
VWAP Analysis
Estimated Session VWAP
-
VWAP Mean: $77,150
Reading
-
Price above VWAP = bullish control
-
Price below VWAP = temporary weakness
-
Current price slightly above fair value
24H VWAP Zone
Estimated 24H Fair Value Range
-
Lower Band: $76,350
-
Mean Zone: $77,000 – $77,300
-
Upper Band: $78,150
Insight
Holding above the mean zone suggests dip buyers still active.
Sentiment Analysis
Crowd Sentiment
-
80% Bullish
-
20% Bearish
Interpretation
Strong optimism supports trend, but excessive bullishness can invite short-term shakeouts.
Sentiment Price Levels
-
Strong Bullish Above: $78,300
-
Neutral Zone: $76,800 – $78,300
-
Bearish Shift Below: $76,000
Smart Money Liquidity Zones
Upside Liquidity Targets
-
$78,500
-
$79,000
-
$80,000
Downside Sweep Zones
-
$76,800
-
$76,000
-
$75,200
Expect stop-hunts around these levels.
Educational Trading Notes
Conservative Traders
Wait for breakout confirmation above supply or bounce from demand.
Aggressive Traders
Use intraday momentum setups with risk control.
Risk Reminder
Sideways ranges can create false breakouts in both directions.
Disclaimer
This content is for educational and informational purposes only and does not constitute financial advice, trading advice, or investment recommendations. Cryptocurrency markets are highly volatile. Always do your own research and consult a licensed advisor before making decisions.
Why Readers Choose One Web One Hub (Please Follow & Bookmark)

24 Apr 2026 BITCOINUSDT FI (Referral Link)
Stay Informed. Stay Ahead.
At One Web One Hub, we transform complex market data into clear daily insights that help readers understand where price may move next.
What You Get
-
Daily Bitcoin & crypto forecasts
-
Smart money zone analysis
-
Beginner-friendly technical breakdowns
-
High-value educational content
-
Consistent market intelligence
Join Our Growing Audience
Bookmark One Web One Hub and return daily for fresh BTC insights, smarter strategy ideas, and market education designed for modern investors.
Previous Post BITCOINUSDT – Probability Analysis for Apr 17, 2026
Next Post BITCOINUSDT – Probability Analysis for May 01, 2026


