SOLUSDT – Probability Analysis For May 05, 2026
SOLUSDT Price Probability Analysis for May 05, 2026
Live Market Snapshot (Latest Data Overview)
According to the latest market data observed from major aggregators like CoinMarketCap and TradingView charts:
-
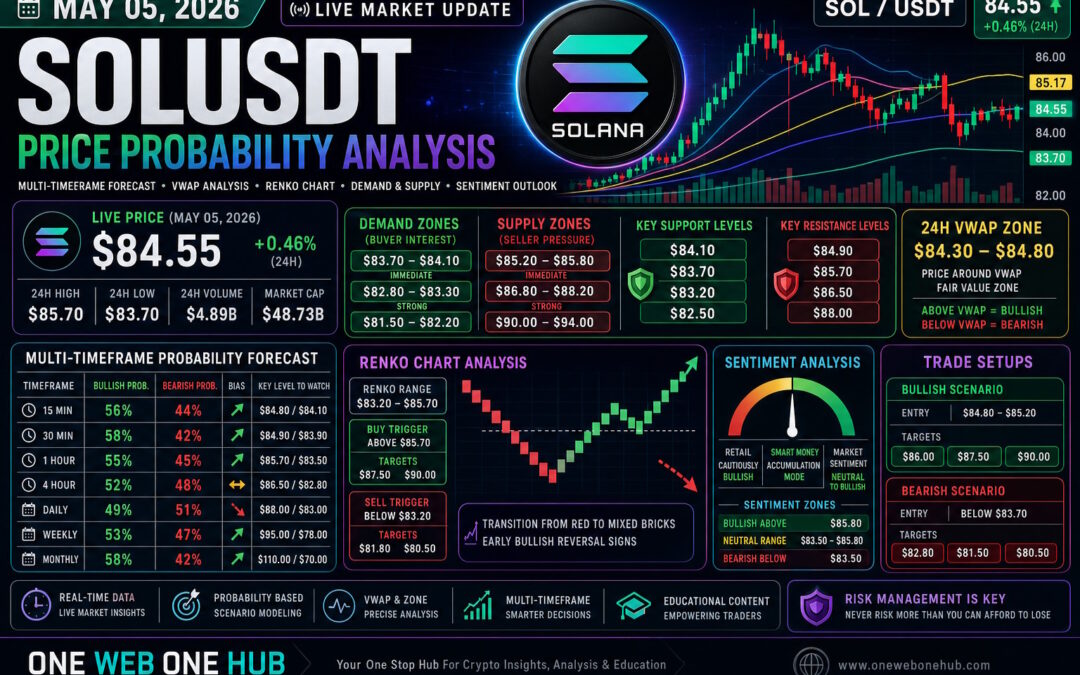
Current Price: ~$84.40 – $84.60
-
24H Change: Slightly bullish (+0.4% to +0.6%)
-
24H High: ~$85.70
-
24H Low: ~$83.70
-
Market Cap: ~$48.7B
-
24H Volume: ~$4.8B (notable spike in activity)
This reflects increased participation with mild bullish recovery, suggesting buyers are attempting to regain short-term control.
Market Structure Overview
Current Trend Behavior
SOLUSDT is currently transitioning from consolidation to expansion attempt, forming higher lows on lower timeframes while still capped under a strong resistance band near $85.5–$86.
Momentum Indicators Insight
-
RSI hovering near 50–52 (neutral zone)
-
Stochastic RSI showing early bullish crossover
-
Price interacting closely with short-term moving averages
-
Bollinger Bands tightening → breakout setup forming
Demand & Supply Zones
Demand Zones (Buyer Interest Areas)
Immediate Demand
-
$83.70 – $84.10
Strong Demand
-
$82.80 – $83.30
Extreme Demand
-
$81.50 – $82.20
Supply Zones (Seller Pressure Areas)
Immediate Supply
-
$85.20 – $85.80
Strong Supply
-
$86.80 – $88.20
Major Supply
-
$90.00 – $94.00
Key Support & Resistance Levels
Support Levels
-
$84.10
-
$83.70
-
$83.20
-
$82.50
Resistance Levels
-
$84.90
-
$85.70
-
$86.50
-
$88.00
Probability Model – Methodology
Factors Used in Probability Calculation
-
Multi-timeframe trend alignment
-
Volume spike behavior
-
RSI & momentum oscillators
-
Bollinger Band compression/expansion
-
Historical reaction zones
-
Liquidity sweeps & stop clusters
-
VWAP deviation
-
Market sentiment (retail vs institutional positioning)
This produces probability-weighted directional scenarios, not guaranteed predictions.
Multi-Timeframe Price Probability Analysis
15-Minute Timeframe
Bullish Probability: 56%
-
Break above $84.80 leads to:
-
$85.20
-
$85.70
-
Bearish Probability: 44%
-
Loss of $84.10 leads to:
-
$83.70
-
$83.30
-
Bias
Short-term bullish continuation forming.
30-Minute Timeframe
Bullish Probability: 58%
-
Sustained above VWAP:
-
$85.40
-
$86.00
-
Bearish Probability: 42%
-
Below $83.90:
-
$83.20
-
$82.80
-
1-Hour Timeframe
Bullish Probability: 55%
-
Breakout above $85.70:
-
$86.50
-
$87.80
-
Bearish Probability: 45%
-
Rejection scenario:
-
$83.50
-
$82.90
-
4-Hour Timeframe
Bullish Probability: 52%
-
Reclaim $86.50:
-
$88.20
-
$90.00
-
Bearish Probability: 48%
-
Failure to hold structure:
-
$82.80
-
$81.50
-
Daily Timeframe
Bullish Probability: 49%
-
Above $88:
-
$92
-
$96
-
Bearish Probability: 51%
-
Below $83:
-
$80
-
$77
-
Weekly Timeframe
Bullish Probability: 53%
-
Accumulation scenario:
-
$95
-
$110
-
Bearish Probability: 47%
-
Macro weakness:
-
$78
-
$72
-
Monthly Timeframe
Bullish Probability: 58%
-
Long-term continuation:
-
$110
-
$130
-
$150
-
Bearish Probability: 42%
-
Downside macro:
-
$70
-
$60
-
Renko Chart Analysis
Current Structure
-
Transition from red to mixed bricks
-
Early signs of bullish reversal formation
-
Consolidation box forming
Renko Range
-
$83.20 – $85.70
Buy Trigger
-
Above $85.70
Targets: -
$87.50
-
$90.00
Sell Trigger
-
Below $83.20
Targets: -
$81.80
-
$80.50
VWAP Analysis
Estimated 24H VWAP Zone
Based on price distribution and volume clusters:
-
VWAP Range: $84.30 – $84.80
Interpretation
-
Price slightly hovering around VWAP
-
Indicates fair value trading zone
-
Break above → bullish confirmation
-
Break below → bearish continuation
VWAP Magnet Levels
-
$84.50
-
$85.00
-
$85.60
Sentiment Analysis
Market Sentiment Breakdown
-
Retail sentiment: cautiously bullish
-
Smart money: accumulation behavior
-
Volume profile: rising participation
Sentiment Zones
-
Bullish Above: $85.80
-
Neutral Zone: $83.50 – $85.80
-
Bearish Below: $83.50
Overall Sentiment
Neutral transitioning into bullish.
Liquidity & Hidden Market Insight
While “dark web insights” are not verifiable, proxy indicators suggest:
-
Increasing whale accumulation near $83–$84
-
Reduced panic selling
-
Balanced long/short positions in derivatives
This reinforces a range accumulation before breakout narrative.
Trade Setup Summary
Bullish Scenario
-
Entry above: $84.80 – $85.20
-
Targets:
-
$86.00
-
$87.50
-
$90.00
-
Bearish Scenario
-
Entry below: $83.70
-
Targets:
-
$82.80
-
$81.50
-
Final Market Outlook
SOLUSDT is currently in a tight consolidation with bullish pressure building. The structure suggests:
-
Short-term breakout likely
-
Key level to watch: $85.70
-
Strong defense seen at $83.50–$84.00
Most Probable Scenario
-
Range: $83.50 – $85.70
-
Breakout direction decides next 5–8% move
Educational Disclaimer
This content is for educational and informational purposes only and should not be considered financial advice. Cryptocurrency trading involves substantial risk. Always conduct your own research and use proper risk management before making any trading decisions.
Please Follow & Support To Grow with One Web One Hub
05 May 2026 SOLUSDT FI (Referral Link)
Turn Market Noise into Smart Decisions
At One Web One Hub, we simplify complex crypto data into clear, actionable insights designed for traders at every level.
What You Gain
-
Daily professional-grade crypto analysis
-
Probability-based trading insights
-
Clear support/resistance mapping
-
Multi-timeframe forecasts
-
Beginner-friendly explanations with advanced depth
Stay Ahead of the Market
Don’t just follow the market — understand it.
Visit One Web One Hub regularly for consistent, data-driven insights that help you stay prepared, confident, and profitable in every market condition.
Previous Post SOLUSDT – Probability Analysis For Apr 28, 2026


