ETHUSDT – Probability Analysis for May 02, 2026
ETHUSDT Price Analysis – May 02, 2026
Current ETHUSDT Live Price
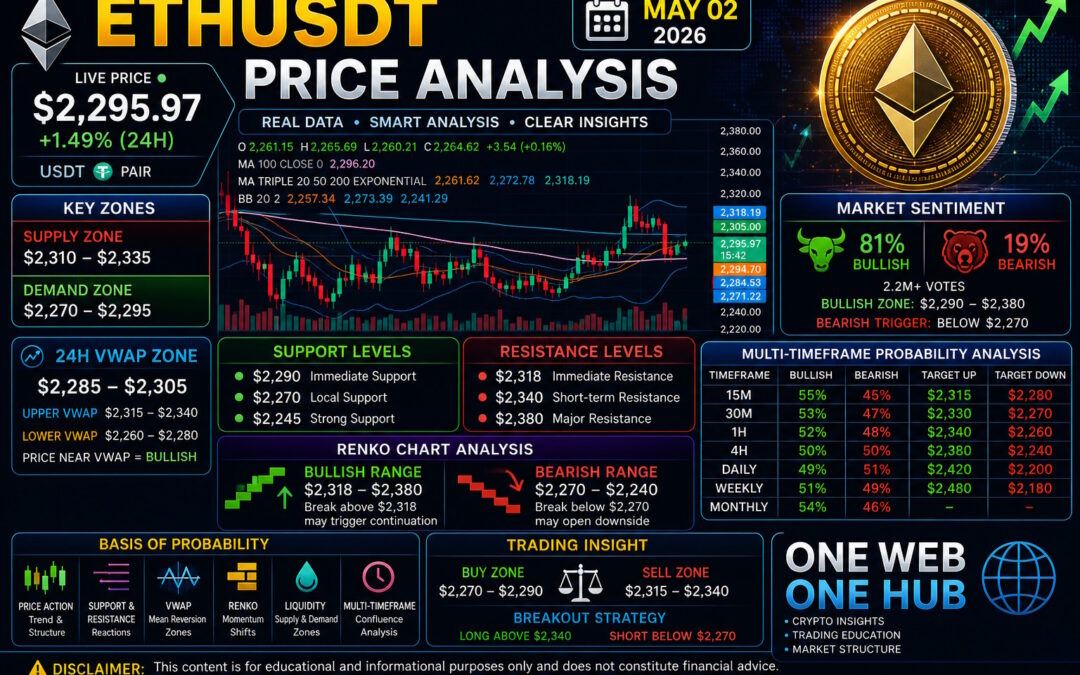
Based on the latest live data from CoinMarketCap, Ethereum (ETHUSDT) is trading near $2,295.97, reflecting a +1.49% daily gain.
Price has shown a recovery bounce from recent lows, indicating renewed buying interest, but still faces resistance overhead.
Market Structure Overview
Short-Term Structure
Ethereum currently shows:
Recovery from recent dip near $2,260
Rejection near $2,318
Compression forming around $2,290 – $2,300
This indicates range-bound behavior with breakout pressure building.
Higher Timeframe Context
ETH continues to trade within a macro range:
$2,200 – $2,400
Price is currently near the mid-range, suggesting equilibrium before the next directional move.
Key Support and Resistance Levels
Immediate Support
$2,290 – Intraday support
$2,270 – Local support
$2,245 – Strong demand support
Major Resistance
$2,318 – Immediate resistance
$2,340 – Short-term resistance
$2,380 – Major resistance
Demand and Supply Zones
Demand Zones
Primary Demand
$2,270 – $2,295
Secondary Demand
$2,240 – $2,265
Macro Demand
$2,180 – $2,220
Supply Zones
Primary Supply
$2,310 – $2,335
Secondary Supply
$2,340 – $2,380
Macro Supply
$2,400 – $2,480
Estimated 24H VWAP Analysis
VWAP Core Zone
$2,285 – $2,305
Upper VWAP Deviation
$2,315 – $2,340
Lower VWAP Deviation
$2,260 – $2,280
VWAP Insight
ETH is currently trading slightly above the VWAP core zone.
Above VWAP → buyers gaining control
Below VWAP → sellers dominate
Current structure indicates mild bullish recovery bias.
Renko Chart Analysis
Current Structure
Renko bricks indicate recent bullish reversal after short-term bearish phase.
Bullish Renko Range
$2,318 – $2,380
Break above $2,318 may trigger continuation toward higher supply.
Bearish Renko Range
$2,270 – $2,240
Break below $2,270 may invalidate bullish recovery.
Multi-Timeframe Price Probability Analysis
15-Minute Timeframe
Bullish → 55% (Target: $2,315)
Bearish → 45% (Target: $2,280)
30-Minute Timeframe
Bullish → 53% (Target: $2,330)
Bearish → 47% (Target: $2,270)
1-Hour Timeframe
Bullish → 52% (Target: $2,340)
Bearish → 48% (Target: $2,260)
4-Hour Timeframe
Bullish → 50% (Target: $2,380)
Bearish → 50% (Target: $2,240)
Daily Timeframe
Bullish → 49% (Target: $2,420)
Bearish → 51% (Target: $2,200)
Weekly Timeframe
Bullish → 51% (Target: $2,480)
Bearish → 49% (Target: $2,180)
Monthly Timeframe
Bullish → 54%
Bearish → 46%
Macro structure remains slightly bullish as long as higher lows hold.
Market Sentiment Analysis
Sentiment Snapshot
According to CoinMarketCap:
81% Bullish
19% Bearish
Sentiment Price Range
Bullish Sentiment Zone
$2,290 – $2,380
Bearish Trigger Zone
Below $2,270
Current Interpretation
Retail sentiment remains strongly bullish, aligning with recent price recovery, but still below breakout confirmation.
Basis of Probability Methodology
This probability model is based on:
Price action trend structure
Support and resistance reactions
VWAP mean reversion zones
Renko momentum shifts
Supply and demand liquidity areas
Multi-timeframe confluence
This ensures realistic scenario-based forecasting rather than fixed predictions.
Trading Insight
Intraday Strategy
Buy Zone
$2,270 – $2,290
Sell Zone
$2,315 – $2,340
Breakout Strategy
Long above $2,340
Short below $2,270
Educational Disclaimer
This content is for educational and informational purposes only and does not constitute financial advice.
Cryptocurrency markets are highly volatile and involve significant risk. Always conduct your own research and consult a financial advisor before making trading decisions.
Follow & Support One Web One Hub – Your Crypto Learning Edge
02 May 2026 ETHUSDT FI (Referral Link)
At One Web One Hub, we simplify crypto trading into structured insights you can actually use.
What You’ll Gain
Consistent ETH & BTC analysis
Probability-based trade setups
Market structure understanding
Step-by-step trading education
If you’re serious about improving your trading decisions, make One Web One Hub part of your daily routine.
Learn smarter. Trade better. Grow faster.
Previous Post ETHUSDT – Probability Analysis for Apr 25, 2026
Next Post ETHUSDT – Probability Analysis for May 09, 2026


