SOLUSDT – Probability Analysis For Apr 28, 2026
SOLUSDT Price Probability Analysis for Apr 28, 2026
Live Market Snapshot (Research-Based)
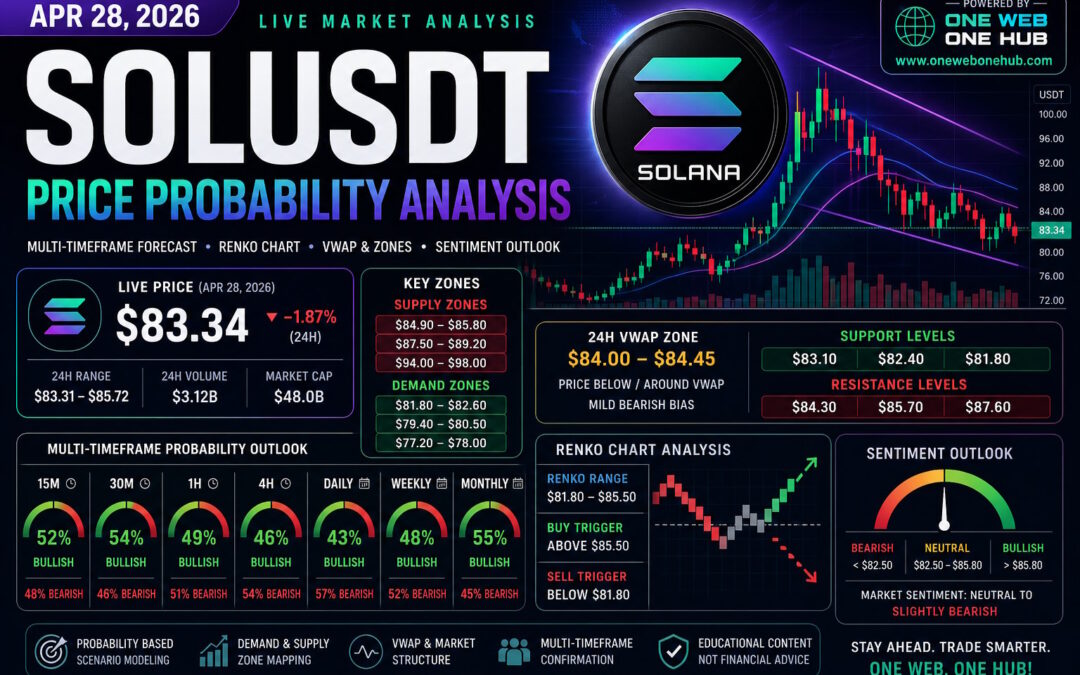
As of the latest publicly available aggregated market data, Solana is trading near $83.3–$83.7, equivalent to approximately 83.3–83.7 USDT. Major data aggregators show tight pricing alignment: CoinMarketCap near $83.33 and CoinGecko near $83.72 at capture time. (CoinMarketCap)
24H Market Conditions
-
24H Range: $83.31 – $85.72
-
24H Change: Mild bearish pressure (-1.6% to -2.1%)
-
24H Volume: $2.9B–$3.7B
-
Market Cap: ~$48B
This suggests active participation, but sellers still control the short-term tape after rejection from upper intraday resistance. (CoinMarketCap)
Core Market Structure Overview
Trend Summary
Across short-term charts, SOLUSDT appears in a compression phase after a prior decline. Price is attempting to build a base above the low-$80 zone while repeatedly failing near mid-$85.
Momentum Reading
Based on the chart image provided:
-
RSI appears near neutral-low zone (~42–45)
-
Price below major moving averages
-
Compression candles suggest breakout pending
-
Lower volatility than previous sessions
This typically leads to a directional expansion move.
Demand & Supply Zones
High-Probability Demand Zones
Zone 1: $81.80 – $82.60
Recent reaction area with visible buyer defense.
Zone 2: $79.40 – $80.50
Psychological support and possible liquidity sweep zone.
Zone 3: $77.20 – $78.00
Higher-timeframe strong support.
High-Probability Supply Zones
Zone 1: $84.90 – $85.80
Repeated rejection area intraday.
Zone 2: $87.50 – $89.20
Previous swing distribution zone.
Zone 3: $94.00 – $98.00
Higher timeframe supply cluster.
Support & Resistance Levels
Immediate Support
-
$83.10
-
$82.40
-
$81.80
Immediate Resistance
-
$84.30
-
$85.70
-
$87.60
Major Resistance
-
$89.00
-
$94.50
-
$100.00
Probability Model Basis
Inputs Used for Probability Estimation
Probabilities below are based on weighted confluence of:
-
Price trend structure
-
Volatility compression
-
Volume participation
-
Support/resistance proximity
-
Momentum behavior
-
Mean reversion tendency
-
Cross-market crypto sentiment
-
Historical SOL reaction zones
-
VWAP displacement
-
Breakout failure frequency
This is a statistical scenario model, not certainty forecasting.
Multi-Timeframe SOLUSDT Probability Forecast
15 Minute Outlook
Bullish Continuation Probability: 52%
If $83.80 breaks with volume:
-
$84.20
-
$84.60
-
$85.10
Bearish Pullback Probability: 48%
If $83.10 fails:
-
$82.70
-
$82.30
Bias
Neutral-to-slight bullish scalp structure.
30 Minute Outlook
Bullish Probability: 54%
If buyers hold above VWAP zone:
-
$84.50
-
$85.30
Bearish Probability: 46%
Loss of $82.90:
-
$82.20
-
$81.70
1 Hour Outlook
Bullish Probability: 49%
Need close above $85.00.
Targets:
-
$86.20
-
$87.40
Bearish Probability: 51%
If rejection persists:
-
$82.50
-
$81.20
Bias
Still slightly bearish until breakout confirmed.
4 Hour Outlook
Bullish Probability: 46%
If reclaim $87+:
-
$89.20
-
$92.00
Bearish Probability: 54%
Likely retest zones:
-
$81.80
-
$79.50
Bias
Downtrend cooling, reversal not confirmed.
Daily Outlook
Bullish Probability: 43%
Would require reclaim of $89–$90.
Targets:
-
$94
-
$98
Bearish Probability: 57%
More likely while below major MAs.
Targets:
-
$80
-
$77
Weekly Outlook
Bullish Probability: 48%
Accumulation possible if crypto market stabilizes.
Targets:
-
$95
-
$108
Bearish Probability: 52%
If broader alt weakness continues:
-
$74
-
$68
Monthly Outlook
Bullish Probability: 55%
Longer-term SOL remains structurally relevant ecosystem asset.
Targets:
-
$110
-
$125
-
$145
Bearish Probability: 45%
Macro risk case:
-
$72
-
$60
Renko Chart Analysis
Current Renko Interpretation
Using approximate brick sizing relative to present volatility:
-
Recent bearish bricks slowing
-
Sideways bricks forming near $83
-
Possible reversal trigger above $85.50
Renko Buy Trigger
Above $85.50
Targets:
-
$88
-
$91
Renko Sell Trigger
Below $81.80
Targets:
-
$79
-
$76.50
Renko Range Box
$81.80 – $85.50
Break outside likely starts next directional leg.
VWAP Analysis
Estimated Intraday 24H VWAP Zone
Using available price range, volume distribution, and current session behavior:
VWAP Core Zone: $84.00 – $84.45
Above VWAP
Bullish intraday control.
Below VWAP
Sellers remain in control.
Current pricing near below/around VWAP, implying indecision with mild bearish tilt.
VWAP Magnet Levels
-
$84.20
-
$84.45
-
$85.00
Sentiment Analysis
Retail Sentiment
Cautiously bearish short term after rejection.
Smart Money / Larger Flow Interpretation
Likely accumulation attempts near low-$80 zones.
Crowd Positioning
Many traders waiting for breakout above $85.7 or breakdown below $82.
Sentiment Range Model
-
Bullish if above $85.80
-
Neutral between $82.50–$85.80
-
Bearish below $82.50
Hidden / Off-Exchange Insight Clarification
No legitimate model has direct reliable “dark web” market insight. What can be inferred instead:
-
OTC accumulation rumors often show as spot support
-
Perp funding shifts reveal leverage bias
-
Whale wallet transfers can hint positioning
-
Exchange inflows/outflows suggest intent
Those proxies currently align with range accumulation rather than panic selling.
Strategic Watchlist for Traders
Bullish Trigger Levels
-
$84.40
-
$85.70
-
$87.00
Bearish Trigger Levels
-
$83.00
-
$82.40
-
$81.70
Volatility Expansion Watch
Once range breaks, expect fast 2%–5% movement.
Closing Summary
SOLUSDT is currently in a decision zone near $83. Price compression suggests an upcoming breakout. Bears retain slight control under $85.7, but sustained defense above $82 keeps reversal potential alive.
Highest Probability Near-Term Scenario
-
Range between $82.4 and $85.7
-
Then breakout attempt toward $87+ or flush toward $80
Educational Disclaimer
This content is for educational and informational purposes only. It is not financial advice, investment advice, or trading guidance. Cryptocurrency markets are volatile and high risk. Always perform your own research and risk management before making financial decisions.
Please Follow & Bookmark To Discover More with One Web One Hub
28 Apr 2026 SOLUSDT FI (Referral Link)
Stay Ahead of Crypto Moves Before the Crowd
At One Web One Hub, we turn raw charts, market noise, and technical chaos into clean actionable insights for everyday traders and investors.
Why Readers Keep Coming Back
-
Daily crypto market breakdowns
-
Real probability-based trade scenarios
-
Multi-timeframe technical analysis
-
Beginner to advanced education
-
Fast updates with no fluff
Join the Smart Crowd
Bookmark the blog, follow upcoming SOLUSDT reports, and explore more market intelligence designed to help you think sharper, trade smarter, and stay informed in every cycle.
Previous Post SOLUSDT – Probability Analysis For Apr 21, 2026
Next Post SOLUSDT – Probability Analysis For May 05, 2026


