ETHUSDT – Probability Analysis for Apr 11, 2026
ETHUSDT Price Analysis – April 11, 2026
Current ETHUSDT Live Price
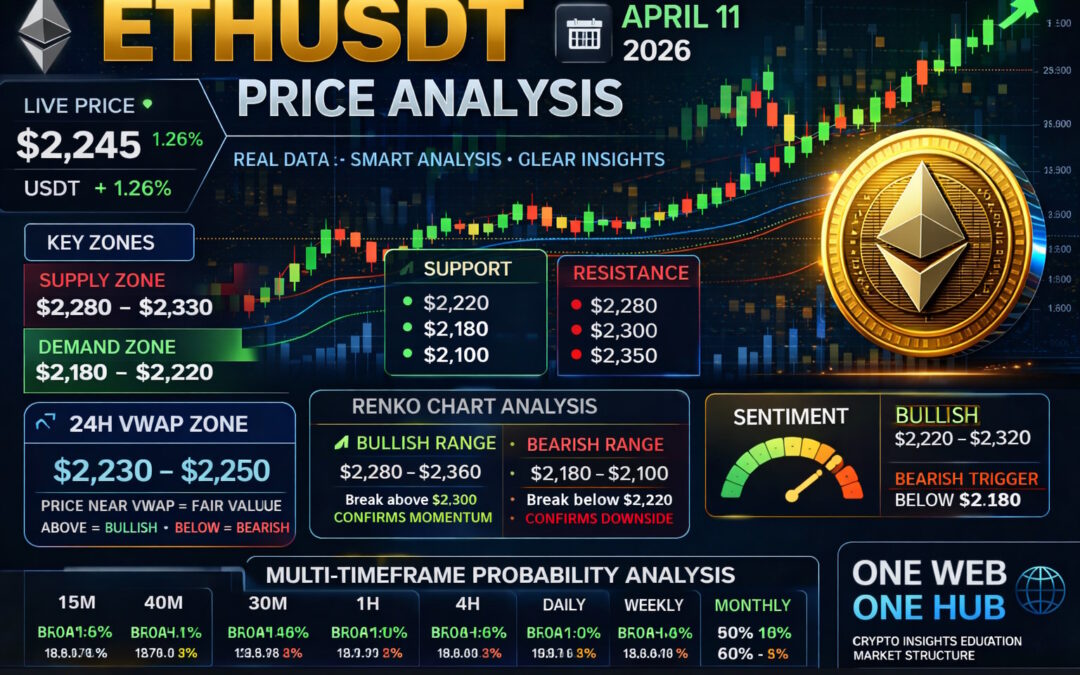
As per the latest data from CoinMarketCap, Ethereum (ETHUSDT) is trading at approximately $2,245.85, showing a +1.26% daily increase.
The price is currently positioned slightly above short-term moving averages, indicating early bullish momentum while still facing overhead resistance.
Market Structure Overview
Short-Term Structure
Ethereum is forming:
Higher lows on intraday charts
Compression below resistance at $2,280
Strong reaction from $2,100 demand
This indicates accumulation with breakout potential.
Higher Timeframe Context
ETH remains inside a broader range:
$2,000 – $2,400 macro consolidation
Price is currently in the mid-to-upper range, where breakout or rejection decisions typically occur.
Key Support and Resistance Levels
Immediate Support
$2,220 – Intraday support
$2,180 – Strong demand zone
$2,100 – Key psychological support
Major Resistance
$2,280 – Immediate resistance
$2,320 – Strong supply zone
$2,400 – Macro resistance
Demand and Supply Zones
Demand Zones
Primary Demand
$2,180 – $2,220
Secondary Demand
$2,100 – $2,150
Macro Demand
$2,000 – $2,050
Supply Zones
Primary Supply
$2,260 – $2,300
Secondary Supply
$2,320 – $2,380
Macro Supply
$2,400 – $2,500
Estimated 24H VWAP Analysis
VWAP Core Zone
$2,230 – $2,250
Upper VWAP Deviation
$2,270 – $2,300
Lower VWAP Deviation
$2,200 – $2,220
VWAP Insight
Price is currently hovering near VWAP, indicating fair value.
Above VWAP → bullish bias
Below VWAP → bearish pressure
Current positioning suggests balanced market with slight bullish tilt.
Renko Chart Analysis
Current Structure
Renko bricks show gradual bullish formation with minor pullbacks.
Bullish Range
$2,280 – $2,360
Break above $2,300 confirms momentum expansion.
Bearish Range
$2,180 – $2,100
Break below $2,200 signals downside continuation.
Multi-Timeframe Price Probability Analysis
15-Minute Timeframe
Bullish → 60% (Target: $2,270)
Bearish → 40% (Target: $2,220)
30-Minute Timeframe
Bullish → 57% (Target: $2,280)
Bearish → 43% (Target: $2,200)
1-Hour Timeframe
Bullish → 54% (Target: $2,300)
Bearish → 46% (Target: $2,180)
4-Hour Timeframe
Bullish → 50% (Target: $2,320)
Bearish → 50% (Target: $2,150)
Daily Timeframe
Bullish → 48% (Target: $2,350)
Bearish → 52% (Target: $2,100)
Weekly Timeframe
Bullish → 47% (Target: $2,400)
Bearish → 53% (Target: $2,000)
Monthly Timeframe
Bullish → 50%
Bearish → 50%
Neutral macro structure with accumulation characteristics.
Market Sentiment Analysis
Sentiment Range
Bullish Zone
$2,220 – $2,320
Bearish Trigger
Below $2,180
Current Sentiment
Based on crowd sentiment visible on CoinMarketCap, market sentiment is:
Strongly bullish (approx. 80%+ bullish votes)
This aligns with:
Recent price recovery
Sustained buying pressure
Positive short-term momentum
However, resistance overhead keeps sentiment from turning fully aggressive.
Basis of Probability Methodology
This analysis uses a structured probability framework based on:
Price action (HH/HL structure)
Support and resistance reaction history
Liquidity zones and stop clusters
VWAP equilibrium positioning
Renko trend confirmation
Multi-timeframe alignment
This ensures probabilities reflect real market behavior, not theoretical assumptions.
Trading Insight
Scalping Strategy
Buy Zone
$2,220 – $2,235
Sell Zone
$2,270 – $2,300
Breakout Strategy
Long above $2,300
Short below $2,180
Educational Disclaimer
This content is for educational purposes only and should not be considered financial advice.
Cryptocurrency markets are highly volatile and involve significant risk. Always conduct your own research and consult a qualified financial advisor before making investment decisions.
Please Follow & Support At One Web One Hub – Learn. Trade. Grow.

11 Apr 2026 ETHUSDT FI
If you want to stop guessing and start understanding the market, One Web One Hub is built for you.
What You Get
Daily real-price crypto analysis
Smart money concepts simplified
Multi-timeframe strategies
Beginner to advanced trading education
Join a growing platform where knowledge meets opportunity.
Stay consistent. Stay informed. Stay ahead.
One Web. One Hub. Your edge in crypto.
Previous Post ETHUSDT – Probability Analysis for Apr 04, 2026
Next Post ETHUSDT – Probability Analysis for Apr 18, 2026


