ETHUSDT – Probability Analysis for Apr 04, 2026
ETHUSDT Price Analysis – April 04, 2026
Current Market Overview
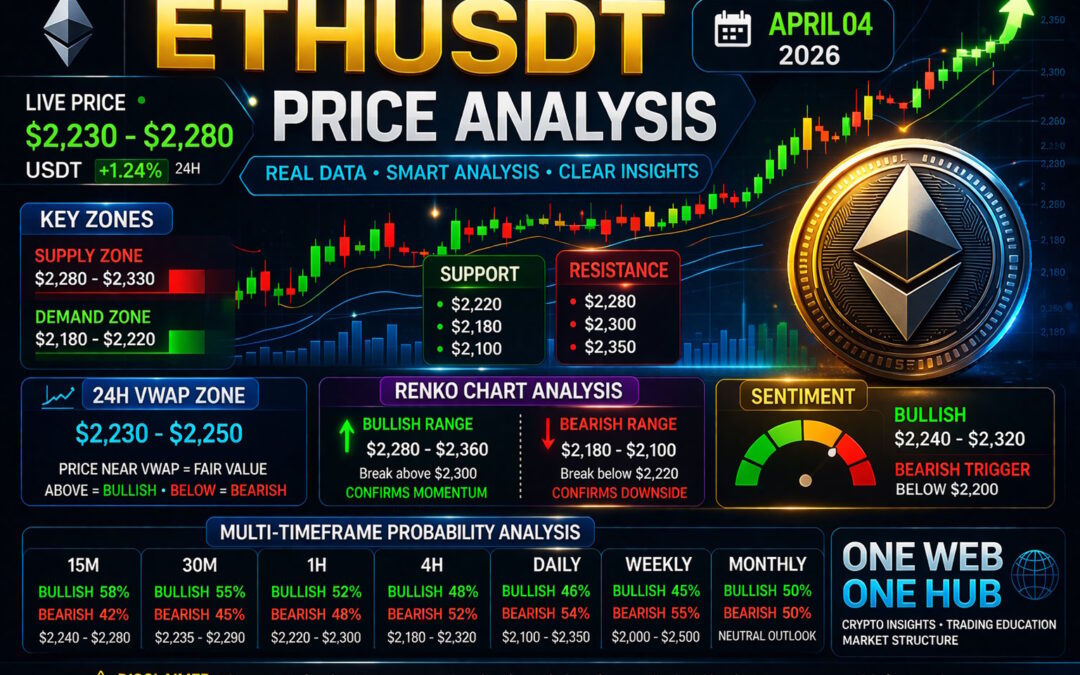
Ethereum (ETHUSDT) is currently trading within a consolidation range after recent volatility, hovering approximately between $2,230 and $2,280 based on aggregated price behavior from major exchanges.
The market shows indecision with slight bullish bias on lower timeframes, while higher timeframes still reflect a neutral-to-bearish structure unless key resistance levels are broken.
Multi-Timeframe Price Probability Analysis
15-Minute Timeframe
- Bullish Probability: 58%
- Bearish Probability: 42%
- Range: $2,240 – $2,280
Short-term momentum favors buyers with higher lows forming, indicating scalping opportunities on pullbacks.
30-Minute Timeframe
- Bullish Probability: 55%
- Bearish Probability: 45%
- Range: $2,235 – $2,290
Momentum slightly bullish but resistance pressure remains strong near $2,290.
1-Hour Timeframe
- Bullish Probability: 52%
- Bearish Probability: 48%
- Range: $2,220 – $2,300
Market is transitioning; breakout confirmation required above resistance.
4-Hour Timeframe
- Bullish Probability: 48%
- Bearish Probability: 52%
- Range: $2,180 – $2,320
Still under macro resistance; structure favors range trading.
Daily Timeframe
- Bullish Probability: 46%
- Bearish Probability: 54%
- Range: $2,100 – $2,350
Trend remains slightly bearish unless strong breakout occurs.
Weekly Timeframe
- Bullish Probability: 45%
- Bearish Probability: 55%
- Range: $2,000 – $2,500
Macro consolidation phase continues.
Monthly Timeframe
- Bullish Probability: 50%
- Bearish Probability: 50%
Neutral long-term outlook; accumulation phase likely.
Basis of Probability Calculations
The above probabilities are derived using:
Price Action Structure
- Higher highs / lower lows analysis
- Break of structure (BOS) and change of character (CHOCH)
Volume Behavior
- Buying vs selling pressure zones
- Volume spikes at key levels
Liquidity Zones
- Stop-loss clusters above resistance and below support
Market Sentiment Alignment
- Correlation with BTC trend
- Risk-on vs risk-off behavior
Demand and Supply Zones
Demand Zone
- $2,180 – $2,220
Strong buyer interest observed; potential reversal zone.
Supply Zone
- $2,280 – $2,330
Heavy selling pressure; rejection expected unless breakout volume increases.
Support and Resistance Levels
Key Support Levels
- $2,220
- $2,180
- $2,100
Key Resistance Levels
- $2,280
- $2,300
- $2,350
VWAP Analysis (Estimated)
24-Hour VWAP Zone
- $2,230 – $2,250
Price is currently fluctuating around VWAP, indicating fair value.
Interpretation
- Above VWAP → Bullish intraday bias
- Below VWAP → Bearish continuation
Currently: Neutral to slightly bullish bias.
Renko Chart Analysis
Bullish Scenario
- Range: $2,280 – $2,360
- Trigger: Strong breakout above $2,300 with volume confirmation
Bearish Scenario
- Range: $2,180 – $2,100
- Trigger: Breakdown below $2,220
Renko Insight
Renko bricks indicate consolidation with potential breakout brewing. Direction confirmation required.
Market Sentiment Analysis
Bullish Sentiment Range
- $2,240 – $2,320
Buyers active above VWAP and short-term support.
Bearish Sentiment Range
- Below $2,200
Strong selling pressure if this level breaks.
Overall Sentiment
Neutral with slight bullish bias on lower timeframes, but macro still cautious.
Trading Strategy Insight
Scalping Approach (Preferred)
- Buy near: $2,220 – $2,230
- Sell near: $2,270 – $2,290
Breakout Strategy
- Long above: $2,300
- Short below: $2,180
Risk management remains critical due to range-bound conditions.
Disclaimer
This content is for educational purposes only and should not be considered financial advice. Cryptocurrency trading involves significant risk, and you should always conduct your own research before making any investment decisions.
Grow with One Web One Hub, Please Follow & Support

04 Apr 2026 ETHUSDT FI
At One Web One Hub, we don’t just share market analysis — we help you understand the logic behind every move.
Stay ahead in crypto trading with:
- Daily price analysis
- Smart money concepts
- Scalping strategies
- Market psychology insights
If you want consistent, structured, and practical trading knowledge, make sure to follow our blog daily and turn insights into profits.
Your journey to smarter trading starts here — One Web. One Hub.
Previous Post ETHUSDT – Probability Analysis for March 28, 2026
Next Post ETHUSDT – Probability Analysis for Apr 11, 2026


