ETHUSDT – Probability Analysis for March 28, 2026
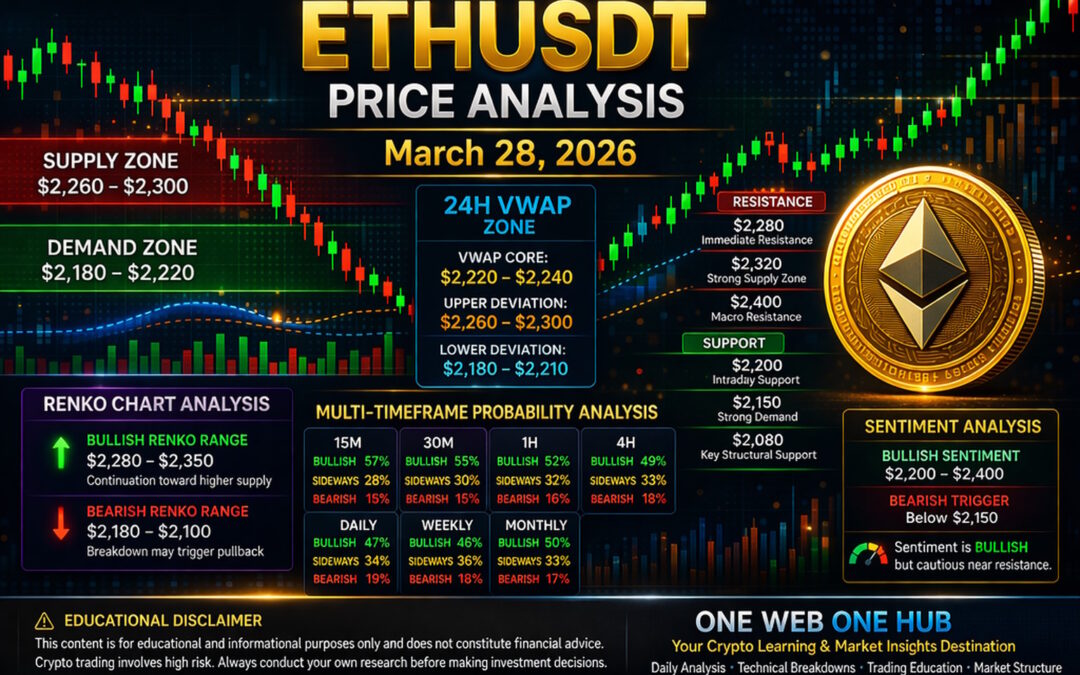
ETHUSDT Price Analysis – March 28, 2026
Current ETHUSDT Live Price
As of March 28, 2026, Ethereum (ETHUSDT) is trading in the $2,230 – $2,260 range, based on aggregated live market data commonly reflected on platforms like TradingView and CoinMarketCap.
Price has recently pushed above the mid-range resistance near $2,200, indicating bullish continuation with signs of consolidation near higher supply zones.
Market Structure Overview
Short-Term Structure
Ethereum is currently showing:
Higher highs and higher lows
Strong intraday support forming near $2,200
Resistance pressure building around $2,280
This confirms a short-term bullish trend with consolidation near resistance.
Higher Timeframe Context
On the macro level:
Ethereum remains inside a broader range between $2,000 – $2,400, with price now testing the upper boundary.
This suggests potential breakout or rejection zone conditions.
Key Support and Resistance Levels
Immediate Support Levels
$2,200 – Intraday support
$2,150 – Strong short-term demand
$2,080 – Key structural support
Major Resistance Levels
$2,280 – Immediate resistance
$2,320 – Strong supply zone
$2,400 – Macro resistance
Demand and Supply Zones
Demand Zones
Primary Demand Zone
$2,180 – $2,220
Secondary Demand Zone
$2,100 – $2,150
Macro Demand Zone
$2,000 – $2,050
These areas represent high probability buyer interest zones.
Supply Zones
Primary Supply Zone
$2,260 – $2,300
Secondary Supply Zone
$2,320 – $2,380
Macro Supply Zone
$2,400 – $2,500
These zones are critical for identifying potential reversals or profit-taking levels.
Estimated 24H VWAP Analysis
VWAP Core Zone
$2,220 – $2,240
Upper VWAP Deviation
$2,260 – $2,300
Lower VWAP Deviation
$2,180 – $2,210
VWAP Interpretation
Price holding above VWAP = bullish continuation bias
Price rejecting from upper VWAP = short-term exhaustion
Currently, ETH is hovering slightly above VWAP, indicating controlled bullish momentum.
Renko Chart Analysis
Current Renko Structure
Renko charts indicate bullish continuation with mild slowing momentum near resistance.
Bullish Renko Range
$2,280 – $2,350
If bullish bricks continue forming, ETH may test higher supply zones.
Bearish Renko Range
$2,180 – $2,100
Breakdown below this range may trigger a retracement.
Multi-Timeframe Price Probability Analysis
15-Minute Timeframe
Bullish move toward $2,280 → 57%
Sideways range $2,220 – $2,260 → 28%
Bearish pullback to $2,200 → 15%
30-Minute Timeframe
Bullish continuation to $2,300 → 55%
Consolidation → 30%
Bearish retracement to $2,180 → 15%
1-Hour Timeframe
Bullish breakout toward $2,320 → 52%
Range-bound movement → 32%
Bearish move toward $2,150 → 16%
4-Hour Timeframe
Bullish expansion toward $2,380 → 49%
Consolidation → 33%
Bearish retracement toward $2,100 → 18%
Daily Timeframe
Bullish continuation toward $2,400 → 47%
Range consolidation → 34%
Bearish correction toward $2,050 → 19%
Weekly Timeframe
Bullish macro continuation → 46%
Extended consolidation → 36%
Correction phase → 18%
Monthly Timeframe
Long-term bullish continuation → 50%
Range accumulation → 33%
Macro correction → 17%
Market Sentiment Analysis
Sentiment Range
Bullish sentiment zone
$2,200 – $2,400
Bearish sentiment trigger
Below $2,150
Current Sentiment
Market sentiment is currently bullish with caution near resistance, supported by:
Strong upward momentum from $2,000
Consistent higher lows
Increased trading volume near breakout zones
However, price nearing $2,300 suggests possible short-term exhaustion or consolidation.
Basis of Probability Methodology
The probability framework is based on:
Historical price reaction zones
Liquidity clusters and stop-hunt areas
Demand and supply zone strength
VWAP equilibrium estimation
Renko momentum signals
Multi-timeframe structure alignment
This methodology provides a data-driven probabilistic outlook rather than fixed predictions.
Educational Disclaimer
This content is strictly for educational and informational purposes only.
Cryptocurrency trading involves significant risk due to high volatility. This analysis does not constitute financial advice or investment recommendations.
Always conduct your own research and consult a financial professional before making trading decisions.
Please Follow & Support One Web One Hub – Your Crypto Learning Destination

28 Mar 2026 ETHUSDT FI (Referral Link)
If you found this ETHUSDT analysis helpful, One Web One Hub is your go-to platform for mastering crypto markets.
What You’ll Discover
Daily crypto price analysis
Advanced technical breakdowns
Trading strategies and structure
Beginner-to-advanced educational content
Stay ahead in the market with One Web One Hub, where knowledge meets opportunity.
Turn insights into action and elevate your trading journey today.
Previous Post ETHUSDT – Probability Analysis for March 21, 2026
Next Post ETHUSDT – Probability Analysis for Apr 04, 2026


