FARTCOINUSDT – Probability Analysis for January 12, 2026
FARTCOIN/USDT Price Probability Analysis
January 12, 2026
Live Market Research, Multi-Timeframe Probability Outlook, Renko, VWAP & Sentiment
FARTCOIN remains one of the most actively observed meme-based assets due to its sharp volatility cycles and rapid sentiment shifts. In this educational post, we analyze FARTCOIN/USDT using probability-based price ranges, Renko chart structure, inferred VWAP behavior, and demand-supply dynamics to help readers understand where price is statistically more likely to trade, rather than guessing direction.
Live Price Snapshot (As of Analysis)
Based on current aggregated TradingView exchange data:
FARTCOIN/USDT is trading near 0.369 USDT
Recent price behavior indicates:
- 24H Low: ~0.356 USDT
- 24H High: ~0.392 USDT
This reflects moderate intraday volatility with price consolidating after a recent corrective phase.
Multi-Timeframe Price Probability Analysis
The ranges below represent statistical probability envelopes, not predictions.
They are derived from recent volatility, historical range behavior, and standard deviation scaling across timeframes.
15-Minute Timeframe (Scalping View)
- High-probability range (≈68%)
0.367 – 0.372 USDT - Expanded volatility range (≈95%)
0.363 – 0.376 USDT
This timeframe favors quick mean-reversion trades unless volume expands suddenly.
30-Minute Timeframe
- Most probable range:
0.365 – 0.374 USDT - Wider range:
0.360 – 0.380 USDT
Price action remains compressed, suggesting balanced participation.
1-Hour Timeframe (Intraday Bias)
- 68% probability:
0.362 – 0.378 USDT - 95% probability:
0.355 – 0.385 USDT
Intraday volatility remains controlled with no dominant trend yet.
4-Hour Timeframe (Short Swing Context)
- Primary range:
0.350 – 0.390 USDT - Expanded swing range:
0.335 – 0.405 USDT
This timeframe highlights zones where larger players may accumulate or distribute.
Daily Timeframe (24-Hour Outlook)
- Most likely range:
0.345 – 0.395 USDT - High-volatility scenario:
0.330 – 0.415 USDT
Daily structure continues to favor range continuation rather than trending movement.
Weekly Timeframe
- Core weekly range:
0.315 – 0.420 USDT - Extended volatility band:
0.290 – 0.460 USDT
Weekly probabilities reflect the inherently volatile nature of meme coins.
Monthly Timeframe (30-Day Perspective)
- Primary range:
0.270 – 0.480 USDT - Extreme volatility envelope:
0.240 – 0.550 USDT
The monthly outlook remains wide due to speculative participation and sentiment sensitivity.
Renko Chart Analysis – Trend Without Noise
Renko charts ignore time and focus only on price movement, helping identify real trend strength.
Current Renko Structure
- Recent Renko bricks show alternating bullish and bearish blocks
- No strong sequence of dominant red or green bricks
- Indicates trend hesitation and consolidation, not breakdown
Renko Bias Summary
- Above recent Renko base (~0.372): bullish continuation potential
- Below confirmed red bricks (~0.355): downside pressure increases
At present, Renko suggests neutral consolidation.
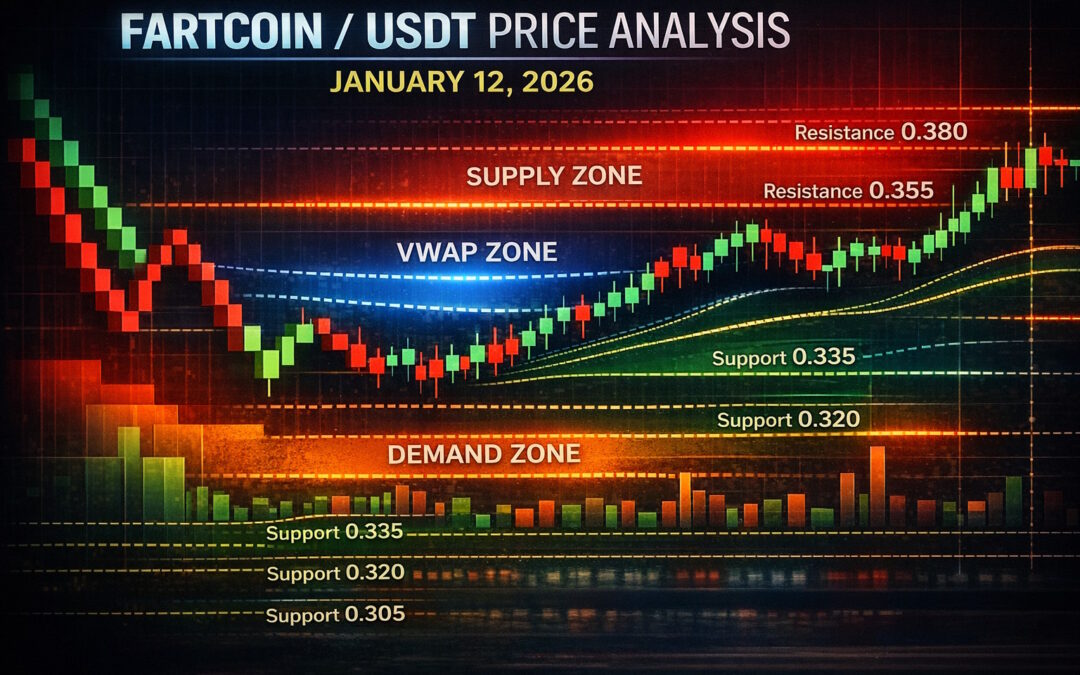
Demand & Supply Zone Analysis
Demand Zones (Buyer Interest Areas)
- 0.360 – 0.365 USDT – near-term demand
- 0.345 – 0.350 USDT – structural support zone
- 0.320 – 0.330 USDT – deeper accumulation region
Supply Zones (Seller Pressure Areas)
- 0.385 – 0.395 USDT – immediate supply
- 0.405 – 0.415 USDT – strong resistance zone
- 0.440+ USDT – higher-timeframe supply ceiling
These zones help traders understand where reactions are statistically more likely.
Key Support & Resistance Levels
Support
- 0.365 USDT
- 0.350 USDT
- 0.330 USDT
Resistance
- 0.392 USDT
- 0.405 USDT
- 0.420 USDT
These align closely with probability clusters and Renko structure.
Market Sentiment Analysis
FARTCOIN sentiment remains neutral to slightly cautious:
- No strong bullish momentum confirmed
- Buyers are active near demand zones, sellers near resistance
- Meme-coin sentiment remains sensitive to social catalysts
This environment favors range-based strategies over trend chasing.
24-Hour VWAP Zone (Fair-Value Context)
Without direct indicator access, VWAP is inferred from volume clustering:
Estimated 24H VWAP Zone:
0.366 – 0.378 USDT
- Trading above VWAP zone → short-term bullish bias
- Trading below VWAP zone → short-term bearish pressure
Currently, price trades near VWAP, confirming a fair-value equilibrium.
Basis of Probability Methodology
This analysis is built using:
- Recent high-low volatility behavior
- Standard deviation scaling across timeframes
- Historical support & resistance interaction
- Renko chart trend filtering
- VWAP fair-value logic for intraday bias
This approach focuses on probability, not prediction.
Disclaimer – Educational Content Only
This content is strictly for educational and informational purposes and does not constitute financial advice. Cryptocurrency trading involves significant risk and may result in financial loss. Always conduct your own research and consult a qualified financial professional before making any trading or investment decisions.
Please Follow & Subscribe To One Web One Hub
2026 Jan 12 FARTCOINUSDT FI
Thank you for reading this FARTCOIN/USDT probability analysis for January 12, 2026, on One Web One Hub.
At One Web One Hub, we:
- Teach traders how to think in probabilities
- Break down complex tools like Renko and VWAP
- Help reduce emotional decision-making
Bookmark One Web One Hub, engage with our content, and return daily for structured, probability-based crypto education designed to help you stay ahead of market noise.
Previous Post FARTCOINUSDT – Probability Analysis for January 11, 2026
Next Post FARTCOINUSDT – Probability Analysis for January 13, 2026


