SOLUSDT – Probability Analysis for November 18, 2025
SOLUSDT — Probability Analysis (Nov 18, 2025)
Live market snapshot (sources)
- Estimated current price (close on Nov 18, 2025): about $130.7 USDT. (YCharts)
- Recent trend & context: Solana peaked earlier in 2025 (~$295 ATH in January) and has been working through a multi-leg pullback/consolidation since — large historic highs help set supply zones. (TradingView)
- 24-hour trading activity/liquidity: Solana shows very large 24-h volume in the billions (CoinGecko / CoinMarketCap live volume figures). (CoinGecko)
- TradingView technical summary for SOL/USDT: commonly renders a Neutral consensus across moving averages & oscillators on the current timeframe (check the SOLUSDT chart for the exact live gauge). (TradingView)
Note: prices and volumes are from public market feeds at the time of writing — always refresh live quotes in TradingView / CoinGecko / CoinMarketCap before trading. (CoinGecko)
Probability scenarios (reproducible thresholds)
Thresholds used (chosen to match SOL’s volatility profile):
- Daily bucket threshold = ±3%.
- Weekly bucket threshold = ±8%.
- Monthly bucket threshold = ±20%.
Daily (24-hour) probabilities
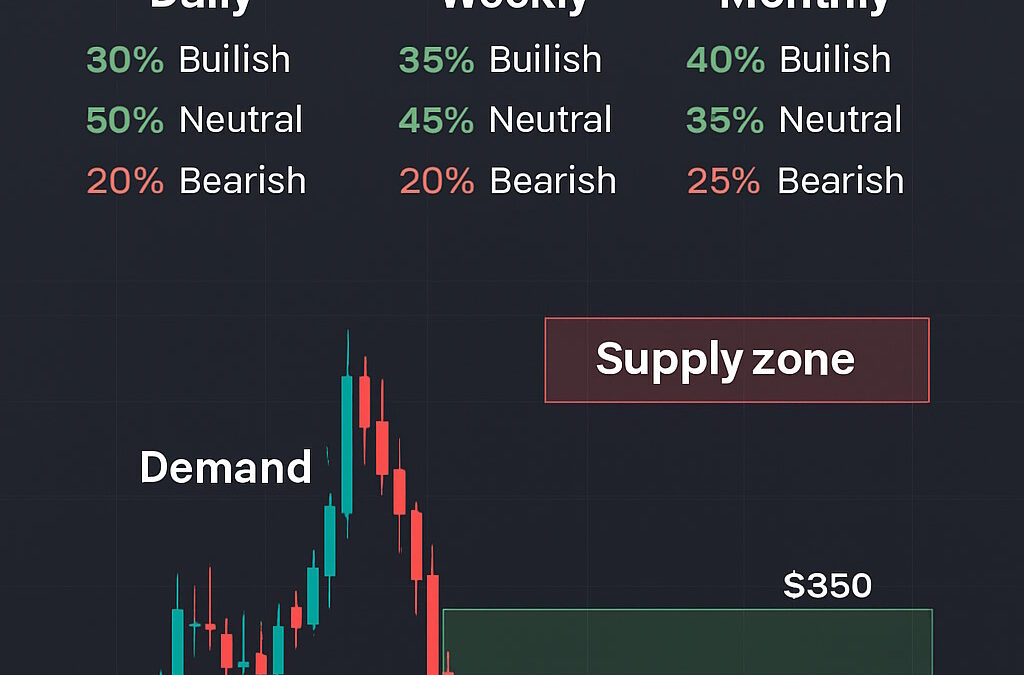
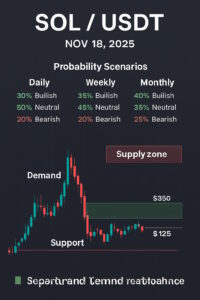
- Bullish (> +3%): 30%
- Neutral (±3%): 50%
- Bearish (> −3%): 20%
Why (daily): price around $130 is inside a consolidation band following recent volatility; TradingView’s neutral technical consensus and high but mixed volume point to rangebound probability being the largest in the next 24 hours. (YCharts)
Weekly (7-day) probabilities
- Bullish (> +8%): 35%
- Neutral (±8%): 45%
- Bearish (> −8%): 20%
Why (weekly): a week gives more time for momentum or catalysts (network news, large inflows, or macro headlines) to push SOL beyond the local range. Liquidity is high so meaningful continuation is possible; neutral remains the single most likely scenario absent a clear breakout. (CoinGecko)
Monthly (30-day) probabilities
- Bullish (≥ +20%): 40%
- Neutral (±20%): 35%
- Bearish (> −20%): 25%
Why (monthly): over 30 days, Solana often makes large directional moves — historical highs and ecosystem events can propel strong rallies, while macro risk can create sizeable drawdowns. Given SOL’s cyclical history (ATH near $295 earlier in the year), a sizable bullish tail is credible, but downside is also material. (TradingView)
Demand & Supply Zones (multi-timeframe)
These zones are identified by looking for prior consolidation/bases (demand) and prior peaks/turning ranges (supply). Use your own chart to draw rectangles around these bands and confirm with volume and price reaction.
Monthly/Major zones
- Major Supply Zone (monthly): $250 – $295 USDT — area of the January 2025 ATH and subsequent selling. (TradingView)
- Major Demand Zone (monthly): $75 – $95 USDT — long-term accumulation zone from earlier cycle lows and deep pullbacks (historical support band). (YCharts)
Weekly/Intermediate zones
- Weekly Supply Zone: $165 – $185 USDT — recent weekly swing highs and prior consolidation that reversed down. (CoinMarketCap)
- Weekly Demand Zone: $115 – $130 USDT — current price area sits near the top of this band; recent daily closes and reaction candles point to buying interest here. (YCharts)
Daily/Short-term zones
- Daily Supply Zone (short term): $140 – $155 USDT — near recent intraday resistances on several exchange listings. (YCharts)
- Daily Demand Zone (short term): $125 – $128 USDT — tight micro-range where buyers entered over the past sessions. (YCharts)
Support & Resistance — key actionable levels
- Immediate support: $125 – $128 USDT (daily demand area). (YCharts)
- Near support / weekly floor: $115 – $130 USDT (weekly demand). (YCharts)
- Immediate resistance: $140 – $155 USDT (daily supply / recent highs). (YCharts)
- Weekly resistance / strong sell area: $165 – $185 USDT. (CoinMarketCap)
- Major resistance / long-term supply: $250 – $295 USDT (ATH band). (TradingView)
How to use them in the probability model:
- If SOL closes a daily candle above $155 on strong volume → increase weekly bullish probability (shift ~ +10–15% from neutral to bullish).
- If SOL breaks below $115 with selling volume → increase weekly/monthly bearish probability (shift toward bearish by ~10–15%).
- Use these level triggers to recompute the buckets — the model is deliberately transparent so you can re-run it with live inputs.
Methodology — transparent & reproducible
- Live inputs: price, recent 24-h high/low, and 24-h volume from CoinGecko / CoinMarketCap (links above). (CoinGecko)
- Technical sentiment baseline: TradingView “Technicals” / indicator summary (gives Neutral/Bullish/Sell consensus per timeframe). (TradingView)
- Define thresholds: daily ±3%, weekly ±8%, monthly ±20% (chosen to reflect SOL’s historical volatility).
- Supply/demand identification: draw zones around the last consolidations preceding big moves (impulse candles) and prior swing highs for supply. Confirm with volume spikes on the initial move. (CoinMarketCap)
- Weighting: assign baseline probabilities (neutral > bullish > bearish) then shift buckets by: price position inside zones, volume strength, technical consensus, and macro/crypto news risk.
- Recompute whenever a decisive breakout/breakdown or major news item occurs.
Risk & trade-management notes
- SOL is a mid-cap crypto with elevated volatility; trade sizes should be scaled to account for potential 10–30% moves on the medium term. (YCharts)
- Always use stop-losses or risk limits; prefer defined R:R setups.
- Futures/perpetual markets amplify moves (funding, liquidations) — avoid excessive leverage unless you understand the risks.
- Reassess probabilities after any exchange listing, major network upgrade, or macro shock.
Disclaimer
This content is educational and informational only. It is not financial, investment, or trading advice. Do not interpret this post as a recommendation to buy, sell, or hold SOL or any asset. Always perform your own research, measure your risk tolerance, and—if necessary—consult a licensed financial professional before trading.
Why One Web One Hub helps
SOLUSDT NOV 18 2025 FI
At One Web One Hub, we deliver daily, reproducible market frameworks that help traders and learners:
- See multi-timeframe probability views (daily/weekly/monthly).
- Identify supply & demand zones and the specific support/resistance levels that matter.
- Apply disciplined risk management rather than emotional decisions.
If you found this useful, bookmark the post, subscribe for daily updates, and join the discussion — we publish fresh charts and visual featured images for every post so you can share concise insights with your social circle.