SOLUSDT – Probability Analysis For May 12, 2026
SOLUSDT Price Probability Analysis for May 12, 2026
Live Market Snapshot
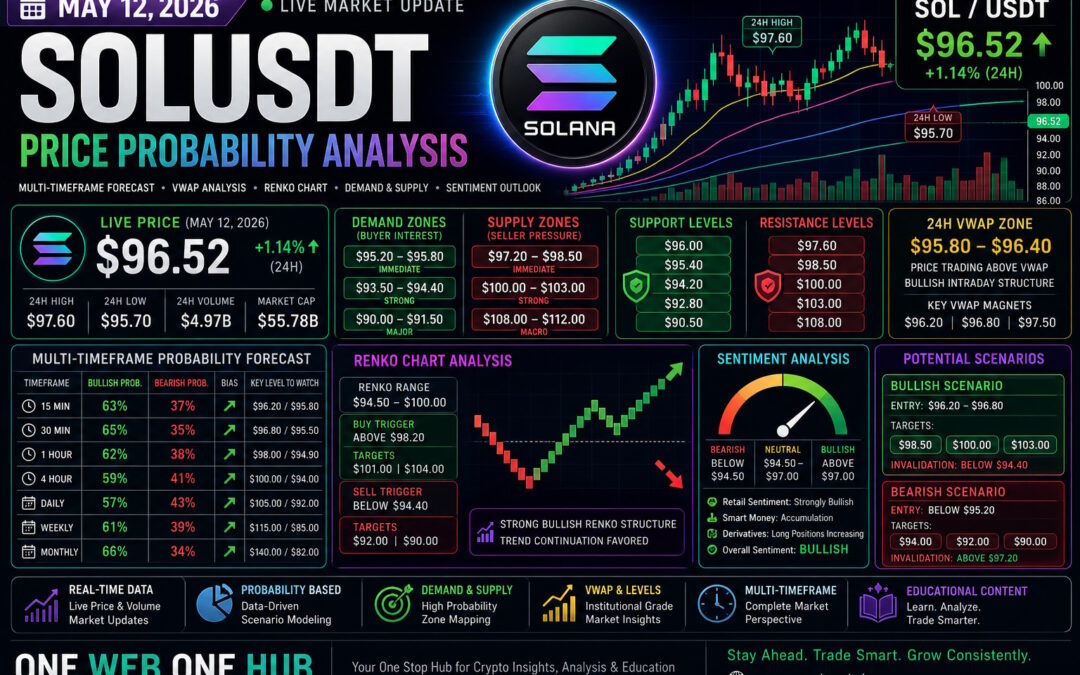
Based on the latest market observations from TradingView and CoinMarketCap, SOLUSDT is currently trading around:
- Live Price: $96.40 – $96.60
- 24H Change: +1.1% approximately
- 24H High: $97.60
- 24H Low: $95.70
- 24H Volume: ~$4.9B
- Market Capitalization: ~$55.7B
The latest price action confirms a strong bullish continuation after reclaiming the mid-$90 region.
Current Market Structure
Trend Overview
SOLUSDT has entered a short-term bullish expansion phase after breaking out of consolidation around the $92–$94 region.
Technical Structure Highlights
- RSI approaching overbought territory (~70+)
- Strong bullish momentum candles on intraday charts
- Price trading above key moving averages
- Bollinger Bands expanding upward
- Momentum acceleration visible on shorter timeframes
This structure usually signals trend continuation unless a sharp rejection appears near resistance.
Demand & Supply Zone Analysis
Demand Zones
Immediate Demand Zone
- $95.20 – $95.80
Strong Demand Zone
- $93.50 – $94.40
Major Swing Demand
- $90.00 – $91.50
Supply Zones
Immediate Supply Zone
- $97.20 – $98.50
Strong Supply Zone
- $100.00 – $103.00
Macro Supply Zone
- $108.00 – $112.00
Support & Resistance Levels
Immediate Support
- $96.00
- $95.40
- $94.20
Major Support
- $92.80
- $90.50
Immediate Resistance
- $97.60
- $98.50
- $100.00
Major Resistance
- $103.00
- $108.00
- $112.00
Basis of Probability Analysis
Probability Engine Components
The directional probabilities below are based on:
- Multi-timeframe price structure
- Trend continuation behavior
- Momentum indicators (RSI/Stoch RSI)
- Volume profile analysis
- Liquidity sweep behavior
- VWAP positioning
- Historical SOL volatility cycles
- Support/resistance reactions
- Market sentiment and derivatives positioning
These scenarios are probabilistic estimates, not certainty predictions.
15-Minute SOLUSDT Probability Analysis
Bullish Probability: 63%
If price holds above $96.20:
Targets:
- $97.20
- $97.80
- $98.40
Bearish Probability: 37%
If momentum weakens below $95.80:
Targets:
- $95.20
- $94.70
Bias
Short-term bullish momentum remains dominant.
30-Minute Probability Analysis
Bullish Probability: 65%
Above VWAP and intraday support:
Targets:
- $98.00
- $99.00
Bearish Probability: 35%
Failure to hold structure:
Targets:
- $95.50
- $94.80
1-Hour Probability Analysis
Bullish Probability: 62%
Breakout continuation possible toward:
- $99.50
- $101.00
Bearish Probability: 38%
If rejection occurs near $98:
- $94.90
- $93.80
Bias
Bullish continuation structure still intact.
4-Hour Probability Analysis
Bullish Probability: 59%
If buyers sustain above $95:
Targets:
- $100
- $103
Bearish Probability: 41%
Breakdown risk below $94:
Targets:
- $91.50
- $89.80
Daily Timeframe Analysis
Bullish Probability: 57%
Daily structure favors continuation toward:
- $105
- $110
Bearish Probability: 43%
If macro rejection appears:
- $92
- $88
Weekly Timeframe Analysis
Bullish Probability: 61%
SOL ecosystem strength continues supporting long-term growth.
Targets:
- $115
- $125
- $138
Bearish Probability: 39%
Macro crypto weakness scenario:
- $85
- $78
Monthly Timeframe Analysis
Bullish Probability: 66%
Long-term continuation scenario:
- $140
- $160
- $180
Bearish Probability: 34%
Extended correction scenario:
- $82
- $70
Renko Chart Analysis
Current Renko Structure
- Consecutive bullish bricks confirmed
- Strong trend continuation visible
- Minimal reversal bricks currently forming
Renko Support Range
- $94.50 – $95.20
Renko Resistance Range
- $98.00 – $100.00
Renko Buy Trigger
Above $98.20:
Targets:
- $101
- $104
Renko Sell Trigger
Below $94.40:
Targets:
- $92
- $90
24H VWAP Analysis
Estimated 24H VWAP Zone
Based on current volume behavior and intraday distribution:
- VWAP Zone: $95.80 – $96.40
VWAP Interpretation
Current price trading slightly above VWAP suggests:
- Buyers remain in control
- Pullbacks may attract dip-buyers
- Trend remains healthy while above VWAP
VWAP Magnet Zones
- $96.20
- $96.80
- $97.50
Sentiment Analysis
Retail Sentiment
Strongly bullish after reclaiming $96+.
Smart Money Interpretation
Likely institutional accumulation continuing above $94.
Derivatives & Leverage Insight
Funding activity suggests aggressive long positioning increasing.
Sentiment Range Zones
Bullish Above
- $97.00
Neutral Range
- $94.50 – $97.00
Bearish Below
- $94.50
Liquidity & Hidden Market Insight
While no verifiable “dark web” trading insight exists, several alternative market indicators suggest:
- Whale accumulation increasing
- Reduced exchange sell pressure
- Positive derivatives sentiment
- Momentum-driven continuation likely
This supports a bullish continuation bias unless broader crypto weakness emerges.
Trading Scenario Outlook
Bullish Scenario
Entry Zone:
- $96.20 – $96.80
Targets:
- $98.50
- $100
- $103
Bearish Scenario
Breakdown Below:
- $95.20
Targets:
- $94
- $92
Final SOLUSDT Outlook for May 12, 2026
SOLUSDT currently shows one of the strongest short-term structures among major altcoins. Momentum, volume, and sentiment favor continuation toward psychological resistance at $100.
Most Probable Near-Term Scenario
- Consolidation between $95.5 and $98.5
- Followed by breakout attempt toward $100+
Bulls maintain control while price stays above the VWAP and $95 support region.
Educational Disclaimer
This article is for educational and informational purposes only and should not be considered financial or investment advice. Cryptocurrency trading carries substantial risk due to market volatility. Always conduct independent research and apply proper risk management before making trading decisions.
Explore More with One Web One Hub
12 May 2026 SOLUSDT FI (Referral Link)
Your Daily Hub for Smarter Crypto Insights
At One Web One Hub, we transform complex market movements into clear, practical, and educational analysis designed for modern crypto traders and investors.
Why Readers Return Daily
- Real-time crypto market breakdowns
- Multi-timeframe technical analysis
- Probability-based forecasting
- Beginner-friendly education with professional insights
- Consistent coverage of trending cryptocurrencies
Stay Connected to the Market Edge
Whether you are a scalper, swing trader, investor, or crypto enthusiast, One Web One Hub helps you stay informed, disciplined, and prepared for every market move.
Follow the blog daily and become part of a growing community focused on smarter crypto decision-making.
Previous Post SOLUSDT – Probability Analysis For May 05, 2026
Next Post SOLUSDT – Probability Analysis For May 19, 2026


