SOLUSDT – Probability Analysis For Jun 02, 2026
SOLUSDT Price Probability Analysis for June 02, 2026
Live Market Overview
Based on the latest TradingView chart data and market conditions visible at the time of analysis:
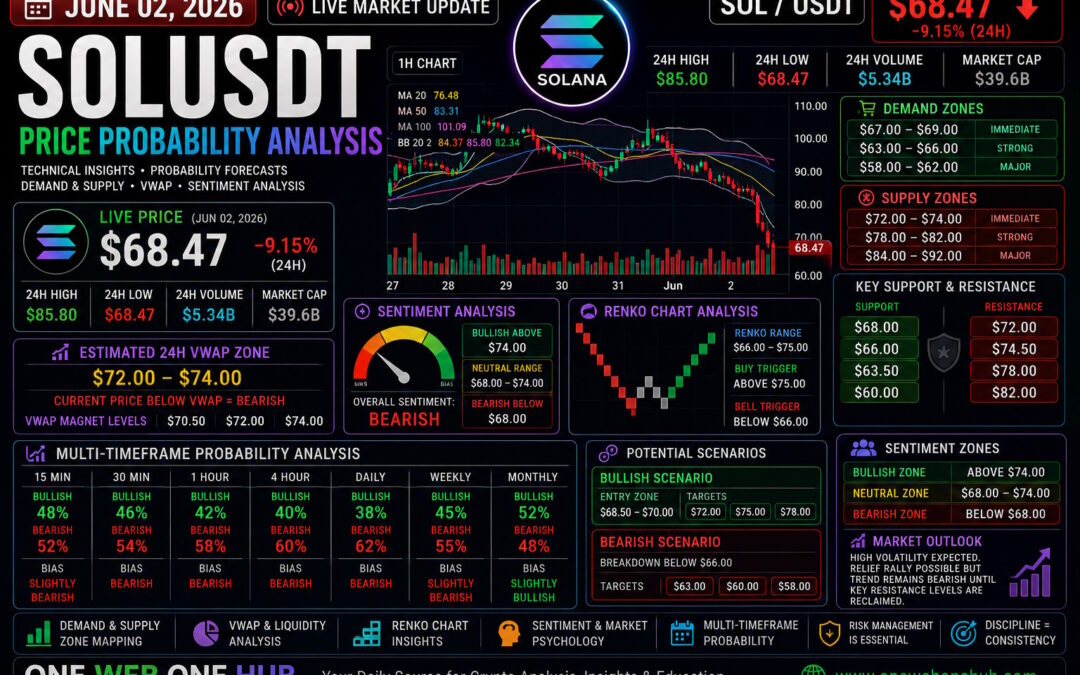
- Current SOLUSDT Price: $68.47
- 24-Hour Change: -9.15%
- 24-Hour High: $85.80
- 24-Hour Low: $68.47
- Market Capitalization: ~$39.6 Billion
- 24-Hour Volume: ~$5.34 Billion
- Volume-to-Market Cap Ratio: 13.47%
The sharp decline indicates a significant liquidation event and strong bearish momentum. Elevated volume confirms that this move is not merely a low-liquidity fluctuation but rather a substantial repricing event.
Market Structure Analysis
Current Trend Assessment
SOLUSDT has experienced a major breakdown from the previous consolidation zone around $82–$85.
Current structure indicates:
- Strong bearish trend
- Breakdown below major moving averages
- Increased volatility
- Elevated liquidation activity
- RSI entering oversold territory
The market is currently seeking a new equilibrium zone.
Probability Analysis Methodology
Factors Used in Probability Modeling
The probability framework incorporates:
- Multi-timeframe trend alignment
- Volume expansion analysis
- RSI and Stochastic RSI positioning
- Historical volatility behavior
- Bollinger Band expansion
- Demand and supply zones
- VWAP approximations
- Market sentiment indicators
- Liquidity and liquidation clusters
- Broader crypto market conditions
These probabilities represent scenario weighting rather than certainty.
Demand Zones
Immediate Demand Zone
$67.00 – $69.00
Recent panic selling is likely to attract short-term bargain hunters.
Strong Demand Zone
$63.00 – $66.00
Historical reaction area with significant buying activity.
Major Demand Zone
$58.00 – $62.00
Long-term accumulation region.
Supply Zones
Immediate Supply Zone
$72.00 – $74.00
First area where trapped buyers may exit positions.
Strong Supply Zone
$78.00 – $82.00
Former support now acting as resistance.
Major Supply Zone
$84.00 – $92.00
Institutional distribution area.
Support and Resistance Levels
Key Support Levels
- $68.00
- $66.00
- $63.50
- $60.00
Key Resistance Levels
- $72.00
- $74.50
- $78.00
- $82.00
15-Minute Probability Analysis
Bullish Probability: 48%
Short-covering bounce possible.
Targets:
- $70.00
- $71.50
Bearish Probability: 52%
Continuation selling remains possible.
Targets:
- $67.00
- $66.00
Bias
Slightly bearish.
30-Minute Probability Analysis
Bullish Probability: 46%
Relief rally scenario.
Targets:
- $72.00
- $73.00
Bearish Probability: 54%
Further downside pressure.
Targets:
- $66.00
- $64.50
1-Hour Probability Analysis
Bullish Probability: 42%
Oversold recovery.
Targets:
- $73.00
- $75.00
Bearish Probability: 58%
Trend continuation.
Targets:
- $65.00
- $63.00
Bias
Bearish.
4-Hour Probability Analysis
Bullish Probability: 40%
Requires reclaim of $74.
Targets:
- $78.00
- $82.00
Bearish Probability: 60%
Dominant trend continuation.
Targets:
- $63.00
- $60.00
Daily Probability Analysis
Bullish Probability: 38%
Recovery from oversold conditions.
Targets:
- $78.00
- $85.00
Bearish Probability: 62%
Primary trend remains bearish.
Targets:
- $60.00
- $55.00
Weekly Probability Analysis
Bullish Probability: 45%
Long-term ecosystem strength may support recovery.
Targets:
- $85.00
- $95.00
Bearish Probability: 55%
Broader crypto weakness persists.
Targets:
- $58.00
- $50.00
Monthly Probability Analysis
Bullish Probability: 52%
Long-term investors may accumulate aggressively.
Targets:
- $100.00
- $120.00
Bearish Probability: 48%
Extended crypto bear cycle.
Targets:
- $50.00
- $42.00
Renko Chart Analysis
Current Renko Structure
Renko analysis indicates:
- Multiple consecutive bearish bricks
- Momentum remains negative
- No confirmed reversal brick sequence yet
Renko Support Range
$66.00 – $68.00
Renko Resistance Range
$72.00 – $75.00
Renko Buy Trigger
Above $75.00
Targets:
- $80.00
- $85.00
Renko Sell Trigger
Below $66.00
Targets:
- $63.00
- $60.00
Estimated 24H VWAP Analysis
Estimated 24H VWAP Zone
Based on visible volume concentration and trading distribution:
- VWAP Zone: $72.00 – $74.00
Current Position Relative to VWAP
Current price at $68.47 remains significantly below estimated VWAP.
This suggests:
- Strong seller dominance
- Negative short-term sentiment
- Potential mean reversion attempts
VWAP Magnet Levels
First Magnet
$70.50
Second Magnet
$72.00
Third Magnet
$74.00
Sentiment Analysis
Retail Sentiment
Fear dominates sentiment following the sharp decline.
Smart Money Perspective
Institutional participants often begin scaling into positions during high-volume capitulation events.
Derivatives Outlook
- Increased liquidations
- Higher volatility
- Elevated funding uncertainty
Sentiment Zones
Bullish Zone
Above $74.00
Neutral Zone
$68.00 – $74.00
Bearish Zone
Below $68.00
Liquidity and Alternative Market Insights
There are no reliable or verifiable “dark web insights” capable of accurately forecasting cryptocurrency prices.
However, alternative indicators suggest:
- Significant long liquidation occurred
- Panic selling increased volume substantially
- Potential accumulation interest emerging near $65–$68
- Volatility expected to remain elevated
Trading Scenario Outlook
Bullish Recovery Scenario
Entry Region:
$68.50 – $70.00
Targets:
- $72.00
- $75.00
- $78.00
Bearish Continuation Scenario
Breakdown Below:
$66.00
Targets:
- $63.00
- $60.00
- $58.00
Final SOLUSDT Outlook for June 02, 2026
SOLUSDT has entered a critical market phase after experiencing a significant selloff. The next several sessions will determine whether this move becomes a capitulation bottom or the beginning of a deeper correction.
Highest Probability Scenario
- Short-term range: $66.00 – $74.00
- Elevated volatility expected
- Relief rally possible but trend remains bearish until key resistance levels are reclaimed
Traders should closely monitor volume behavior, support retention, and recovery attempts toward the estimated VWAP zone.
Educational Disclaimer
This content is provided solely for educational and informational purposes. It should not be interpreted as financial advice, investment advice, or trading recommendations. Cryptocurrency markets are highly volatile and involve significant risk. Always perform your own research and consult qualified financial professionals before making investment decisions.
Why Thousands of Readers Follow One Web One Hub
02 Jun 2026 SOLUSDT FI (Referral Link)
Daily Crypto Intelligence Without the Noise
One Web One Hub delivers structured, easy-to-understand market analysis designed to help traders and investors navigate volatile cryptocurrency markets.
What Makes Our Analysis Different
- Multi-timeframe probability forecasting
- Demand and supply zone mapping
- Renko and VWAP analysis
- Sentiment-driven market insights
- Educational content for all experience levels
Stay Ahead of Market Moves
Whether you’re a beginner learning market structure or an experienced trader seeking additional perspectives, One Web One Hub provides daily crypto intelligence designed to keep you informed and prepared.
Bookmark One Web One Hub today and join a growing community dedicated to smarter crypto analysis, better risk management, and long-term market education.
Previous Post SOLUSDT – Probability Analysis For May 26, 2026


