ETHUSDT – Probability Analysis for May 30, 2026
ETHUSDT Price Analysis – May 30, 2026
Current ETHUSDT Live Price
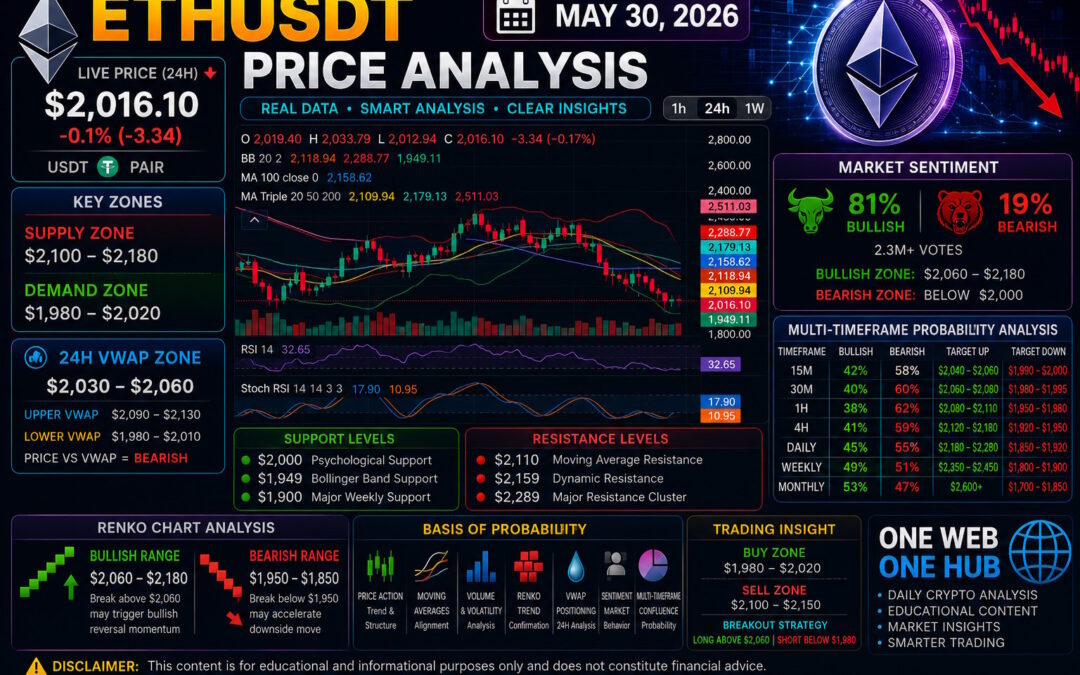
According to the latest market data visible from the provided market snapshot, Ethereum (ETHUSDT) is trading near $2,016.10, reflecting a 0.1% decline over the last 24 hours.
Ethereum continues to trade under major moving averages while testing a critical psychological support region around $2,000. This area may determine whether ETH begins a recovery phase or extends its bearish trend into June.
Market Structure Overview
Short-Term Structure
Current market structure shows:
Lower highs continue to form below $2,120
Selling pressure remains dominant
Momentum indicators remain oversold
Volume remains elevated during downside moves
The short-term trend remains bearish until ETH can reclaim major resistance zones.
Higher Timeframe Context
Ethereum remains inside a broader macro range:
$1,900 – $2,450
The current price is approaching the lower end of the range where institutional demand historically becomes more active.
Key Support and Resistance Levels
Immediate Support
$2,000 – Psychological support
$1,949 – Bollinger Band support
$1,900 – Major weekly support
Immediate Resistance
$2,110 – Moving average resistance
$2,159 – Dynamic resistance
$2,179 – Major resistance cluster
Major Resistance
$2,289
$2,400
$2,511
Demand and Supply Zones
Primary Demand Zone
$1,980 – $2,020
This area contains the strongest concentration of recent buying activity.
Secondary Demand Zone
$1,900 – $1,950
This zone represents a major defensive area for long-term bulls.
Primary Supply Zone
$2,100 – $2,180
This area contains multiple moving averages and recent breakdown levels.
Secondary Supply Zone
$2,250 – $2,320
A recovery into this area could attract significant profit-taking.
Macro Supply Zone
$2,400 – $2,520
This remains the dominant resistance region for the broader trend.
Estimated 24-Hour VWAP Analysis
Estimated VWAP Core Zone
$2,030 – $2,060
Upper VWAP Deviation Zone
$2,090 – $2,130
Lower VWAP Deviation Zone
$1,980 – $2,010
VWAP Interpretation
ETH is currently trading below the estimated 24-hour VWAP equilibrium area.
This indicates:
Seller dominance remains active
Recovery attempts may face resistance near VWAP
A reclaim of VWAP would improve short-term bullish probabilities
Current VWAP bias remains bearish.
Renko Chart Analysis
Current Renko Structure
Renko analysis continues to show bearish bricks dominating the chart structure.
Recent breakdowns below $2,100 have confirmed downside momentum.
Bullish Renko Range
$2,060 – $2,180
A breakout above this range could trigger a trend reversal.
Bearish Renko Range
$1,950 – $1,850
Failure to hold $2,000 may activate this downside target zone.
Renko Trend Bias
Bearish with oversold conditions developing.
Multi-Timeframe Price Probability Analysis
15-Minute Timeframe
Bullish Probability: 42%
Target Range: $2,040 – $2,060
Bearish Probability: 58%
Target Range: $1,990 – $2,000
30-Minute Timeframe
Bullish Probability: 40%
Target Range: $2,060 – $2,080
Bearish Probability: 60%
Target Range: $1,980 – $1,995
1-Hour Timeframe
Bullish Probability: 38%
Target Range: $2,080 – $2,110
Bearish Probability: 62%
Target Range: $1,950 – $1,980
4-Hour Timeframe
Bullish Probability: 41%
Target Range: $2,120 – $2,180
Bearish Probability: 59%
Target Range: $1,920 – $1,950
Daily Timeframe
Bullish Probability: 45%
Target Range: $2,180 – $2,280
Bearish Probability: 55%
Target Range: $1,850 – $1,920
Weekly Timeframe
Bullish Probability: 49%
Target Range: $2,350 – $2,450
Bearish Probability: 51%
Target Range: $1,800 – $1,900
Monthly Timeframe
Bullish Probability: 53%
Target Range: $2,600+
Bearish Probability: 47%
Target Range: $1,700 – $1,850
Long-term accumulation conditions continue improving despite current weakness.
Market Sentiment Analysis
Community Sentiment
Current market sentiment remains:
Bullish: 81%
Bearish: 19%
Sentiment Price Zones
Bullish Recovery Zone
$2,060 – $2,180
Neutral Zone
$2,000 – $2,060
Bearish Continuation Zone
Below $2,000
Sentiment Interpretation
Despite recent selling pressure, retail participants remain overwhelmingly bullish. Historically, extreme bullish sentiment during declines can either signal strong confidence or indicate that additional downside volatility remains possible before a larger recovery.
Basis of Probability Analysis
Factors Used
Price action structure
Support and resistance strength
Bollinger Band positioning
Moving average alignment
Volume behavior
Renko trend confirmation
Estimated VWAP positioning
Market sentiment readings
Multi-timeframe confluence
The probability model is designed to estimate likely scenarios rather than predict exact outcomes.
Trading Insight
Conservative Bullish Setup
Potential accumulation zone:
$1,980 – $2,020
Confirmation level:
Above $2,060
Upside target:
$2,110 – $2,180
Conservative Bearish Setup
Breakdown trigger:
Below $1,980
Downside target:
$1,920 – $1,850
Risk Management Reminder
Never risk more capital than you can afford to lose.
Always use stop-loss protection.
Avoid excessive leverage during highly volatile periods.
Educational Disclaimer
This content is provided strictly for educational and informational purposes only and should not be considered financial, investment, or trading advice.
Cryptocurrency markets are highly volatile and involve substantial risk. Always conduct your own independent research and consult a qualified financial professional before making investment decisions.
One Web One Hub – Your Daily Crypto Intelligence Destination

30 May 2026 ETHUSDT FI (Referral Link)
Why Traders Visit One Web One Hub
Daily cryptocurrency market analysis
Ethereum and Bitcoin price forecasts
Technical analysis education
VWAP and Renko chart breakdowns
Trading psychology insights
Risk management strategies
Market sentiment monitoring
Stay Ahead of the Market
The crypto market changes every day. Successful traders adapt faster than the crowd.
Follow One Web One Hub for educational market insights, weekly forecasts, technical breakdowns, and probability-based analysis designed to help you make more informed trading decisions.
One Web One Hub continues to deliver data-driven crypto education that helps traders understand market structure rather than simply chase price action.
Previous Post ETHUSDT – Probability Analysis for May 23, 2026
Next Post ETHUSDT – Probability Analysis for Jun 06, 2026