by Muhammad Taha Farooq | Oct 31, 2026 | Educational, General Research
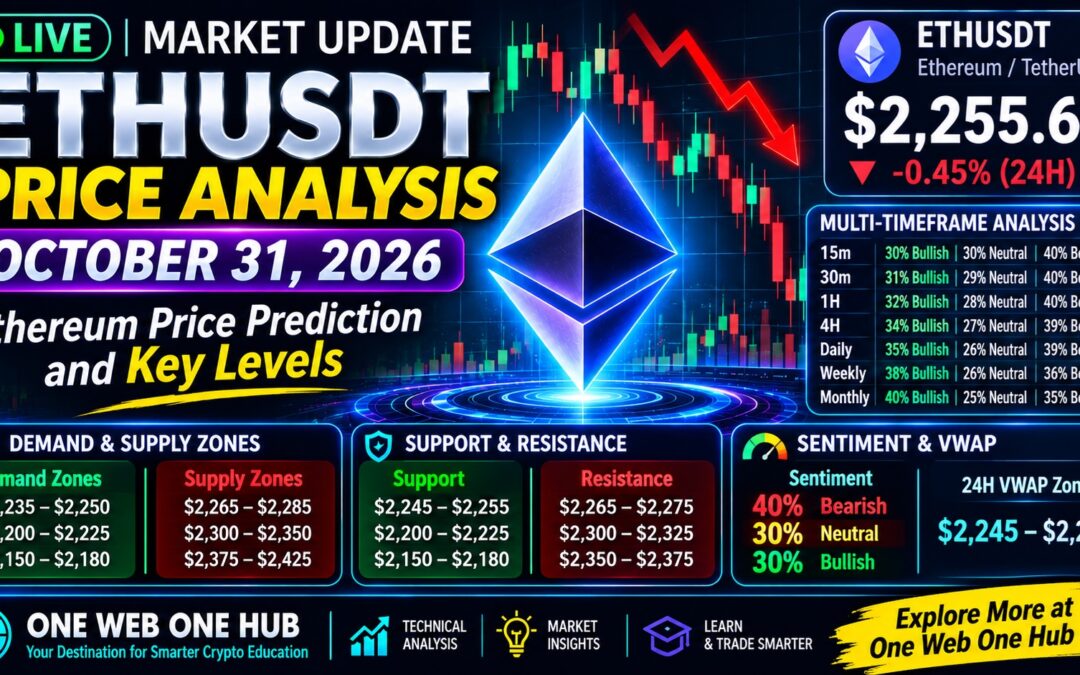
Ethereum (ETHUSDT) closed October 31, 2026, at approximately $2,255.66 following a challenging month for the market. This analysis examines short- and long-term price probabilities across seven timeframes, key support and resistance levels, Renko chart signals, demand and supply zones, market sentiment, and the estimated 24-hour VWAP. Discover the technical levels and market factors that could shape Ethereum’s next move with One Web One Hub.
by Muhammad Taha Farooq | Oct 30, 2026 | Educational, General Research
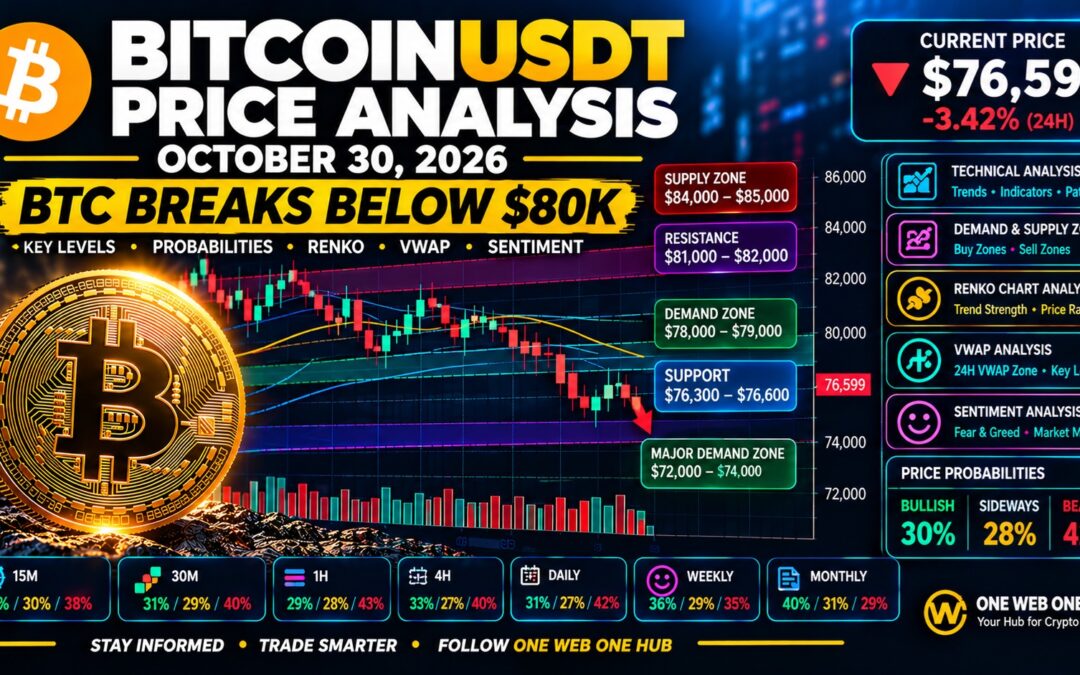
Bitcoin faced renewed selling pressure on October 30, 2026, following reports of a Binance security incident, with BTC falling below the $80,000 psychological level. This BitcoinUSDT analysis examines seven timeframe scenarios, key support and resistance levels, Renko chart ranges, demand and supply zones, market sentiment, and estimated 24-hour VWAP zones to help readers understand potential bullish, sideways, and bearish price movements.
by Muhammad Taha Farooq | Oct 29, 2026 | Educational, General Research
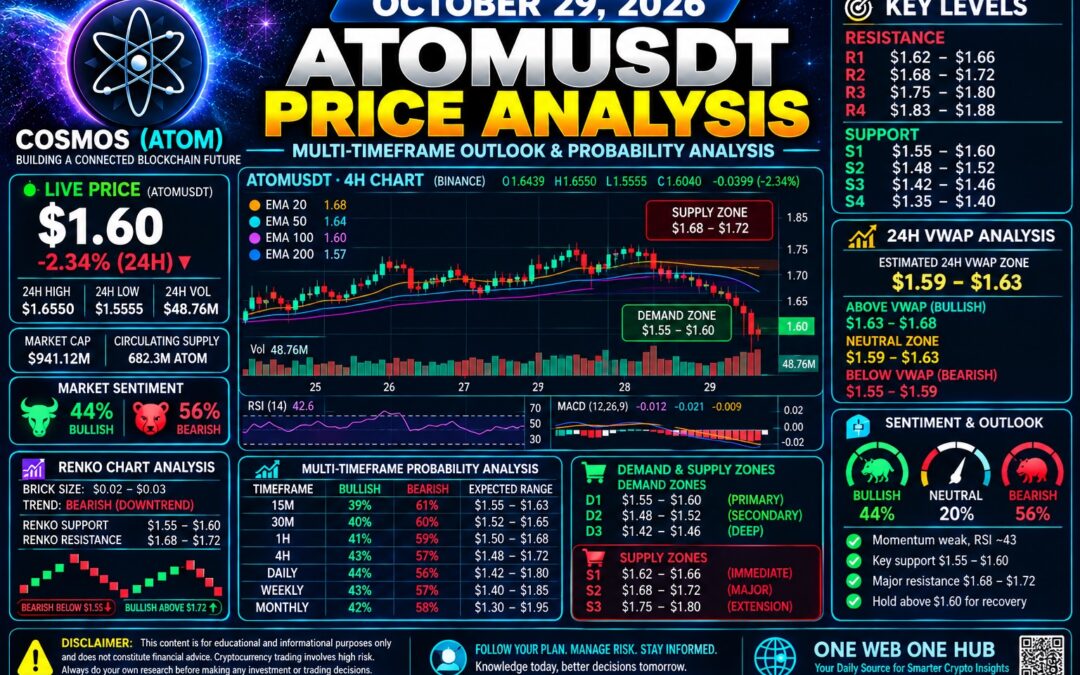
ATOMUSDT faces a critical support test after falling toward $1.60 on October 29, 2026, with the session low near $1.56. Explore bullish and bearish price probabilities across 15-minute to monthly timeframes, Renko chart scenarios, estimated 24-hour VWAP, market sentiment, demand and supply zones, and key support and resistance levels. Follow One Web One Hub for ongoing Cosmos market analysis and cryptocurrency insights.
The key finding for this edition is that ATOMUSDT experienced a significant sell-off on October 29, 2026. ChartExchange’s composite ATOMUSDT history records an open of $1.6439, a high of $1.6550, a low of $1.5555, and a close of $1.6040. Other data providers report different closing values, reflecting differences in market coverage and daily candle timing.