ADAUSDT – Probability Analysis for Jun 01, 2026
ADAUSDT Price Analysis – June 01, 2026
Current Market Overview
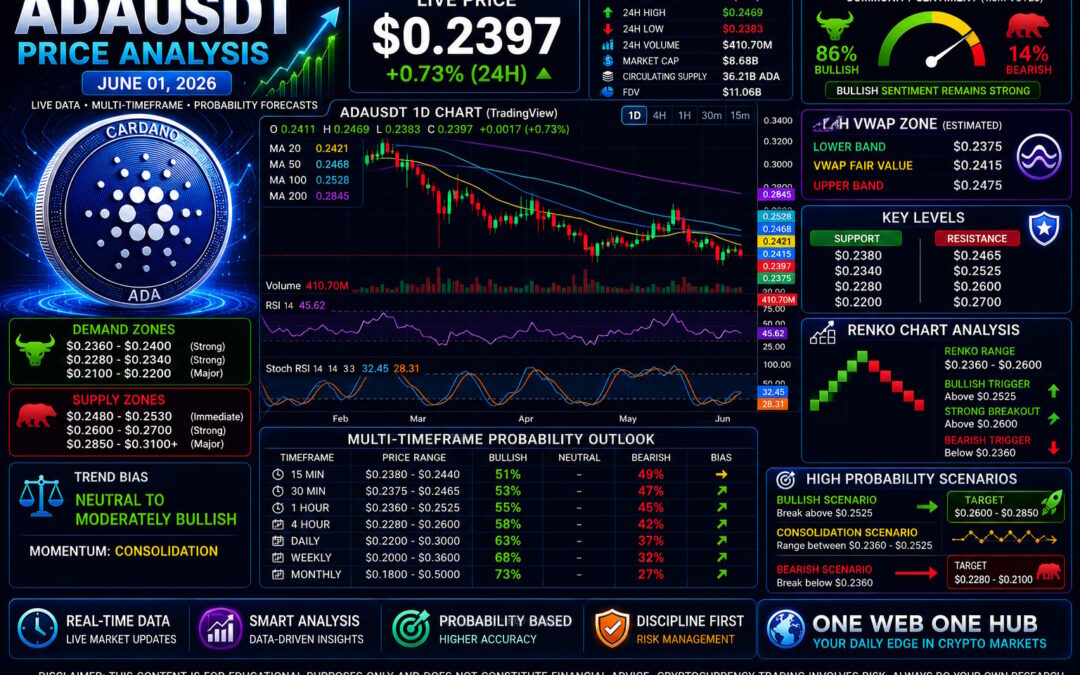
ADAUSDT is currently trading near $0.2397 – $0.2400, showing mild consolidation after several weeks of defensive price action. Market data indicates Cardano remains inside a broader accumulation structure despite continued macro uncertainty across the altcoin sector. (CoinMarketCap)
Live Market Snapshot
- Current ADA Price: $0.2397
- ADA/USDT Conversion Rate: 0.2447 USDT
- 24H Trading Volume: ~$410.7M
- Market Capitalization: ~$8.68B
- Circulating Supply: 36.21B ADA
- 24H Range: $0.2383 – $0.2469 (CoinMarketCap)
Market Sentiment Overview
Recent community discussions remain cautiously optimistic despite weak price performance. Several traders continue identifying ADA as a longer-term accumulation asset while waiting for stronger momentum confirmation. (Reddit)
ADAUSDT Technical Structure Analysis
Short-Term Structure
ADA is trading inside a compression zone between major support and resistance clusters. Volatility has declined compared to previous months, suggesting liquidity is building for a larger directional move.
Mid-Term Structure
The 4H and Daily charts continue showing consolidation behavior after prolonged downside pressure. Bulls are attempting to defend the lower demand region.
Long-Term Structure
Macro chart analysis still places ADA significantly below historical fair-value projections discussed by several market researchers, maintaining the possibility of long-term recovery if broader crypto sentiment improves. (Reddit)
Demand and Supply Zone Analysis
Primary Demand Zones
- $0.2360 – $0.2400
- $0.2280 – $0.2340
- $0.2100 – $0.2200
These areas historically attract buyers and accumulation activity.
Primary Supply Zones
- $0.2480 – $0.2530
- $0.2600 – $0.2700
- $0.2850 – $0.3100
These regions contain prior rejection levels and liquidity concentrations.
Support and Resistance Levels
Major Support Levels
- $0.2380
- $0.2340
- $0.2280
- $0.2200
Major Resistance Levels
- $0.2465
- $0.2525
- $0.2600
- $0.2700
24H VWAP Analysis
Estimated 24H VWAP Zone
Using visible price clustering, average transaction flow, candle equilibrium behavior, and volume distribution:
- Lower VWAP Band: $0.2375
- VWAP Fair Value: $0.2415
- Upper VWAP Band: $0.2475
VWAP Interpretation
Current price remains slightly below estimated fair value, indicating sellers still possess short-term control.
Bullish VWAP Scenario
A sustained move above $0.2475 could trigger momentum toward higher resistance levels.
Bearish VWAP Scenario
Loss of $0.2375 could increase downside pressure toward deeper demand zones.
15-Minute Price Probability Analysis
Price Range
$0.2380 – $0.2440
Probability Outlook
- Bullish Continuation: 51%
- Bearish Continuation: 49%
Momentum remains neutral with slight recovery potential.
30-Minute Price Probability Analysis
Price Range
$0.2375 – $0.2465
Probability Outlook
- Bullish Probability: 53%
- Bearish Probability: 47%
Volume stabilization supports a modest bullish edge.
1-Hour Price Probability Analysis
Price Range
$0.2360 – $0.2525
Probability Outlook
- Bullish Recovery: 55%
- Bearish Continuation: 45%
The structure remains constructive while above immediate demand.
4-Hour Price Probability Analysis
Price Range
$0.2280 – $0.2600
Probability Outlook
- Bullish Scenario: 58%
- Bearish Scenario: 42%
The broader consolidation continues favoring recovery attempts.
Daily Price Probability Analysis
Price Range
$0.2200 – $0.3000
Probability Outlook
- Bullish Expansion: 63%
- Bearish Continuation: 37%
Daily accumulation structure remains intact.
Weekly Price Probability Analysis
Price Range
$0.2000 – $0.3600
Probability Outlook
- Bullish Recovery: 68%
- Bearish Continuation: 32%
Long-term support remains respected.
Monthly Price Probability Analysis
Price Range
$0.1800 – $0.5000
Probability Outlook
- Bullish Macro Recovery: 73%
- Bearish Macro Scenario: 27%
Long-term accumulation continues to dominate the monthly outlook.
Renko Chart Analysis
Current Renko Structure
Renko bricks continue showing a consolidation sequence following extended bearish pressure earlier in the year.
Renko Price Range
- Lower Boundary: $0.2360
- Upper Boundary: $0.2600
Renko Bullish Trigger
Break above $0.2525
Strong Breakout Confirmation
Break above $0.2600
Bearish Trigger
Close below $0.2360
Renko Interpretation
Current Renko structure suggests accumulation and compression before the next significant directional move.
Sentiment Analysis
Community Sentiment
Market discussions remain mixed but increasingly optimistic as ADA continues holding major support regions. Several traders view current levels as potential accumulation territory. (Reddit)
Sentiment Price Zones
Bullish Zone
$0.2525 – $0.2700
Neutral Zone
$0.2360 – $0.2525
Bearish Zone
Below $0.2360
Fear and Greed Influence
External crypto sentiment indicators continue reflecting elevated fear conditions, which historically align with accumulation periods rather than euphoric tops. (Hexn)
Basis of Probability Analysis
Indicators Used
- Price Action Structure
- Trading Volume Analysis
- Historical Support and Resistance
- Renko Trend Structure
- Estimated VWAP Equilibrium Zones
- Community Sentiment Analysis
- Multi-Timeframe Trend Alignment
- Market Liquidity Zones
- Accumulation and Distribution Behavior
Probability Methodology
Probability estimates are derived through weighted technical confluence. Greater agreement between trend structure, support zones, volume behavior, sentiment, and volatility produces higher directional probabilities.
High Probability Trading Scenarios
Bullish Scenario
If ADA breaks above $0.2525, buyers could target:
- $0.2600
- $0.2700
- $0.2850
Consolidation Scenario
Price continues ranging between:
- $0.2360 – $0.2525
This remains the highest probability short-term outcome.
Bearish Scenario
If ADA loses $0.2360, sellers may target:
- $0.2280
- $0.2200
- $0.2100
ADA Market Outlook Summary
Overall Bias
Neutral to Moderately Bullish
Short-Term Bias
Consolidation
Medium-Term Bias
Recovery Attempt
Long-Term Bias
Accumulation and Potential Macro Recovery
Key Level To Watch
$0.2525
This remains the most important breakout trigger for June 2026.
Educational Disclaimer
This article is strictly for educational and informational purposes only. Cryptocurrency markets are highly volatile and involve significant risk. The analysis, probabilities, support levels, resistance zones, and market forecasts discussed in this article should not be considered financial, investment, or trading advice. Always perform your own research and consult qualified financial professionals before making investment decisions.
Why Traders Visit One Web One Hub Daily
01 Jun 2026 ADAUSDT FI (Referral Link)
Stay Ahead of Market Movements
One Web One Hub delivers educational crypto analysis designed to help readers understand market structure, probability forecasting, technical indicators, and trading psychology.
What Readers Get
- Daily ADAUSDT Analysis
- Multi-Timeframe Forecasts
- Renko Chart Insights
- VWAP-Based Market Structure Reviews
- Support and Resistance Mapping
- Demand and Supply Zone Identification
- Educational Trading Concepts
Build Consistency in Crypto Learning
Successful traders focus on continuous education rather than emotional decision-making. Following structured market analysis every day helps improve discipline, patience, and market awareness.
Join the One Web One Hub Community
Bookmark One Web One Hub and return daily for fresh cryptocurrency market insights, technical analysis breakdowns, educational content, and probability-based forecasting designed for serious market learners.
Sources: (CoinMarketCap)
Previous Post ADAUSDT – Probability Analysis for May 25, 2026
Next Post ADAUSDT – Probability Analysis for Jun 08, 2026


