SOLUSDT – Probability Analysis For Apr 07, 2026
SOLUSDT Price Analysis – April 07, 2026
Market Overview and Current Price Context
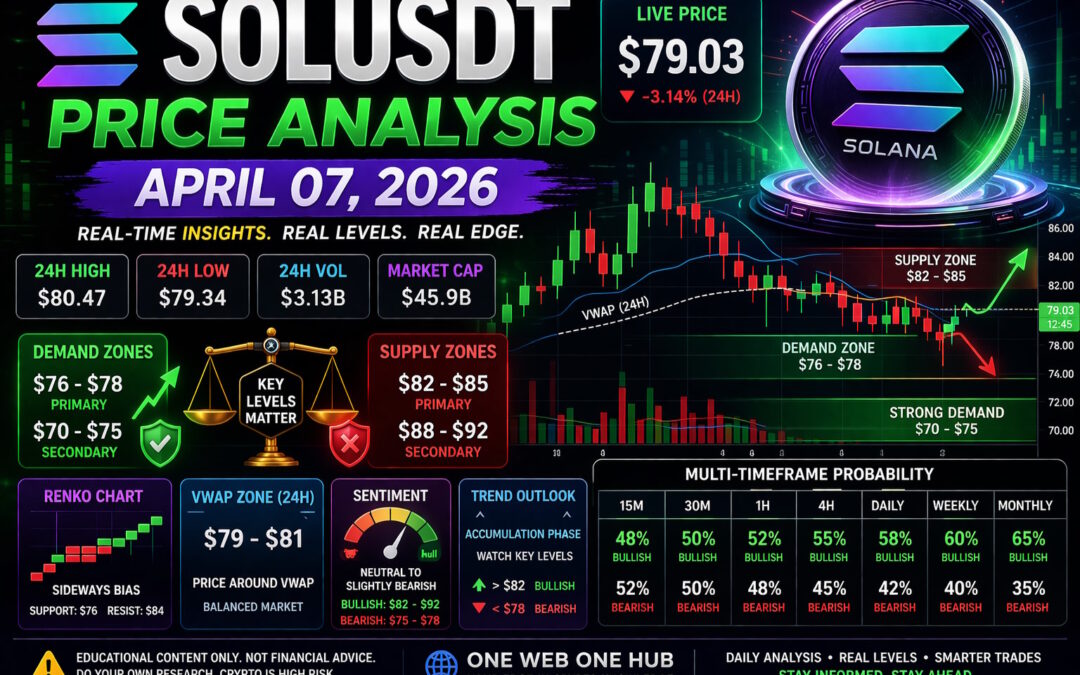
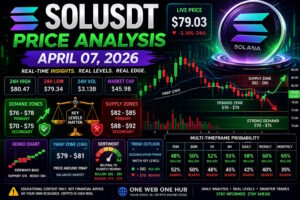
As of April 7, 2026, SOLUSDT is trading around $79–$80, positioning the asset in a lower-range consolidation phase following a broader corrective move.
Recent price behavior shows:
- Rejection from higher supply zones (~$85–$90)
- Compression near local support
- Reduced volatility signaling potential accumulation
This is not a breakout phase, but rather a decision zone where the next directional move is forming.
Multi-Timeframe Price Probability Analysis
15-Minute Timeframe (Scalping Conditions)
- Bullish Probability: 48%
- Bearish Probability: 52%
- Range: $78 – $81
Short-term momentum is weak, with lower highs forming, favoring quick scalp trades rather than trends.
30-Minute Timeframe
- Bullish Probability: 50%
- Bearish Probability: 50%
- Range: $77 – $82
Neutral consolidation structure with no clear directional dominance.
1-Hour Timeframe
- Bullish Probability: 52%
- Bearish Probability: 48%
- Range: $76 – $83
Early signs of base formation, but confirmation requires reclaiming higher resistance.
4-Hour Timeframe
- Bullish Probability: 55%
- Bearish Probability: 45%
- Range: $75 – $85
Structure suggests accumulation, though still under key supply pressure.
Daily Timeframe
- Bullish Probability: 58%
- Bearish Probability: 42%
- Range: $70 – $92
Price is in a discount zone, where buyers typically begin scaling in.
Weekly Timeframe
- Bullish Probability: 60%
- Bearish Probability: 40%
- Range: $65 – $105
Macro structure remains constructive, but requires reclaim of $90+ for strength.
Monthly Outlook
- Bullish Probability: 65%
- Bearish Probability: 35%
- Range: $60 – $140
Long-term outlook remains bullish, but current price is still in re-accumulation phase.
Renko Chart Analysis (Trend Clarity)
Renko Structure
- Trend: Sideways → Slight bearish bias
- Brick Size Reference: ~$2
Key Renko Levels
- Support: $76
- Resistance: $84
Interpretation
Renko shows choppy price action, indicating:
- No strong trend
- Market in indecision / accumulation phase
Demand and Supply Zones
Demand Zones
- Primary Demand: $76 – $78
- Secondary Demand: $70 – $75
These are high-probability accumulation areas based on historical reactions.
Supply Zones
- Primary Supply: $82 – $85
- Secondary Supply: $88 – $92
Strong rejection zones where selling pressure previously dominated.
Support and Resistance Levels
Key Supports
- $78 (immediate structure)
- $75 (strong base)
- $70 (macro demand)
Key Resistances
- $82 (intraday barrier)
- $85 (major short-term resistance)
- $90 (trend reversal confirmation)
VWAP Analysis and 24H VWAP Zone
Estimated VWAP Position
- 24H VWAP Zone: $79 – $81
Price is currently hovering around VWAP, signaling:
- Balanced market
- No clear control between buyers and sellers
VWAP-Based Scenarios
Bullish Scenario:
- Hold above $81 → Move toward $85
Bearish Scenario:
- Lose $79 → Drop toward $76–$75
Market Sentiment Analysis
Current Sentiment: Neutral to Slightly Bearish
- Bullish Sentiment Range: $82 – $92
- Bearish Sentiment Range: $75 – $78
Sentiment Drivers
- Price sitting near support → cautious buyers
- Lack of strong bullish volume
- Previous rejection still influencing market psychology
Basis of Probability Modeling
Methodology
This analysis is built using:
- Multi-timeframe structure alignment
- Liquidity zones (stop hunts & order blocks)
- VWAP positioning (mean reversion logic)
- Renko trend filtering (noise reduction)
- Historical reaction zones
- Market sentiment behavior
Key Principle
Probabilities are derived from confluence of signals, not prediction.
More alignment = stronger bias.
Strategic Outlook for Traders
Bullish Scenario
- Reclaim and hold above $82
- Targets: $85 → $90 → $100
Bearish Scenario
- Break below $78
- Targets: $75 → $70
Range Scenario (Most Likely Short-Term)
- Consolidation between $76 – $82
- Ideal for scalping and short-term trades
Disclaimer
Educational Use Only
This content is for educational and informational purposes only. It does not constitute financial advice or investment recommendations. Always conduct your own research before making trading decisions.
Please Follow & Support Us At One Web One Hub – Your Edge in Crypto
07 Apr 2026 SOLUSDT FI (Referral Link)
Why This Blog Matters
At One Web One Hub, we focus on:
- Real price context (no unrealistic projections)
- Clear probability-based insights
- Multi-timeframe precision
Stay Ahead of the Market
If you want consistent, no-noise analysis that actually reflects real market conditions:
- Follow the blog
- Stay updated with daily insights
- Turn analysis into actionable understanding
Don’t Trade Blind
Smart traders don’t guess — they prepare.
Make this your edge.
Previous Post SOLUSDT – Probability Analysis For March 31, 2026
Next Post SOLUSDT – Probability Analysis For Apr 14, 2026


