FARTCOINUSDT – Probability Analysis for September 30, 2025
FARTCOIN / USDT — Probability Analysis
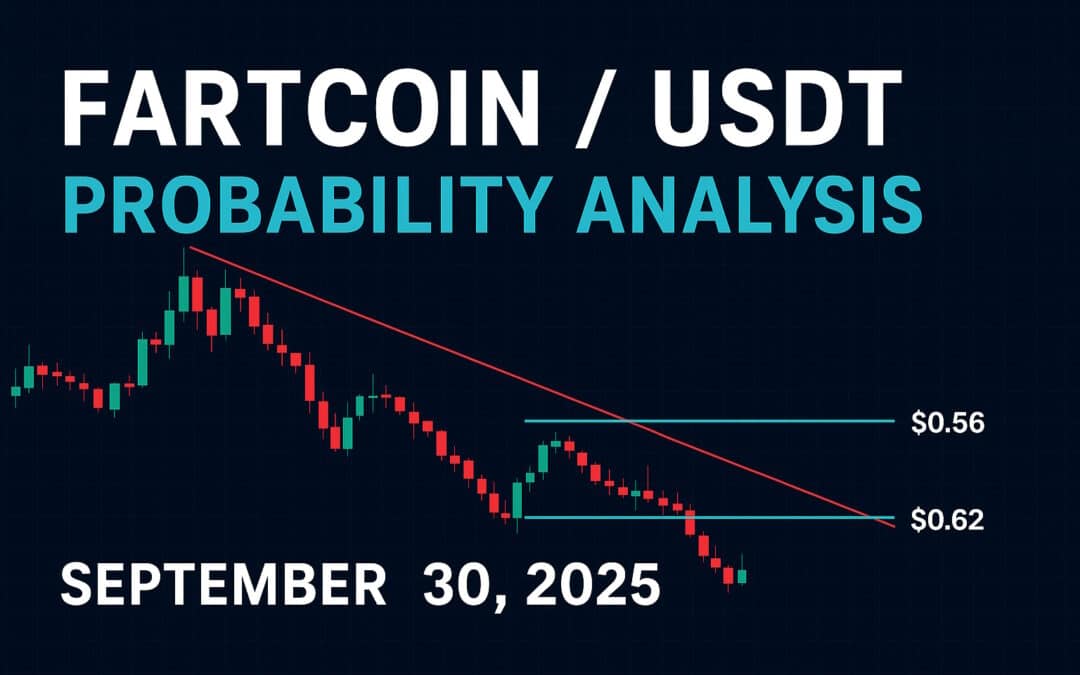
Date: September 30, 2025
1. Live Snapshot & Market Context
- Current Price: ~ $0.5573 USDT (CoinGecko) (CoinGecko)
- 24-Hour Movement: ~ −9.5% drop in last 24h (CoinGecko)
- Volume & Range: The token has traded between ~$0.5436 and ~$0.6195 on Binance Futures, per Cryptometer data. (cryptometer.io)
- Sentiment & Trend: Market sentiment remains bearish, technical indicators favor downside, and forecast models continue to project lower ranges. (CoinCodex)
These data points confirm the prevailing downward pressure and the lack of clear support zones being defended.
2. Key Price Levels to Watch
| Type | Level (USDT) | Importance |
|---|---|---|
| Support / Floor | $0.52 – $0.56 | Current trading floor; breaking this would deepen downside risk |
| Next structural support | $0.45 – $0.50 | If the above fails, this is the likely next region of interest |
| Resistance / Bounce hurdle | $0.60 – $0.63 | Where recovery attempts may face strong seller interest |
| Bullish invalidation zone | $0.78 – $0.90+ | Only sustained closes above this would change overall bias |
3. Probability Scenarios & Outlook
Daily (Next 24h)
- Downside continuation: ~ 60%
Expect another test and possible break of ~$0.52. - Sideways / consolidation: ~ 25%
Price may oscillate between ~$0.52 and ~$0.60 if sellers lose aggression. - Relief bounce: ~ 15%
A sharp bounce toward ~$0.60–$0.63 is possible, but needs strong volume and conviction.
Weekly (Next 7 Days)
- Further re-price downward: ~ 50%
Price may drift into $0.40 – $0.55 if bearish momentum persists. - Base / consolidation zone: ~ 35%
Possible trading band between $0.45 – $0.60 if selling pressure eases. - Recovery push: ~ 15%
A bounce toward $0.65 – $0.80 is possible if macro sentiment improves and capital rotates back in.
Monthly (Next 30 Days)
- Bear continuation / lower range: ~ 45%
Price may extend lower into $0.30 – $0.55 if selling pressure and weak sentiment persist. - Slow upward repair: ~ 35%
Over weeks, price might drift back into $0.55 – $0.80 with accumulation and better volume. - Strong rebound / breakout: ~ 20%
A push above $0.90+ requires a potent catalyst (listing, protocol news, viral momentum) to reverse the trend.
4. Trade Ideas & Strategy Suggestions
- Short continuation (aggressive):
Entry: Breakdown below $0.52 with volume.
Stop: ~$0.58 – $0.60.
Targets: $0.45, then deeper. - Conservative bounce attempt:
Entry: Buy small size near $0.54 – $0.56 if reversal signal + positive volume.
Stop: Tight ~2–3%.
Target: $0.60 first, stretch to $0.63. - Scalp / range trades:
In choppy conditions, buy near $0.52 – $0.56 and sell near $0.60 – $0.63 with tight stops. - DCA / Accumulation plan:
Use small equal-$ tranches spaced downward (say, every $0.02 or $0.03) from ~$0.56 → ~$0.40.
Set exit rules: once price recovers to average cost + $0.03–$0.05, recover initial capital and ride any remaining upside.
5. Risk Controls & What to Monitor
- Exchange inflows / whale flows: Big inflows = pressure; big withdrawals = possible accumulation shift.
- Derivatives metrics (OI & funding): Falling open interest with negative funding signals weakness; shift to rising OI or positive funding may hint at turnaround.
- Volume on bounce attempts: Only count upward moves if volume exceeds ~1.2× average.
- VWAP & EMA slope on mid / daily charts: If price breaks above VWAP and EMAs begin to flatten / rise, bias may shift.
- News / sentiment catalysts: Pay attention to listings, protocol updates, or viral coverage shifts.
6. Summary & Tactical Takeaways

FARTCOINUSDT Sept 30 2025 FI
As of September 30, 2025, FARTCOIN/USDT trades at ~$0.5573, with strong bearish momentum and limited support. The daily and weekly outlooks lean toward further downside unless buyers intervene forcefully. Over monthly horizon, the possibility of a base or partial recovery exists — but the dominant bias remains to the downside until volume, market flow, or news intervenes.
Disclaimer:
The content on this website is for educational purposes only and not to be taken as financial advice. Please do your own research.


