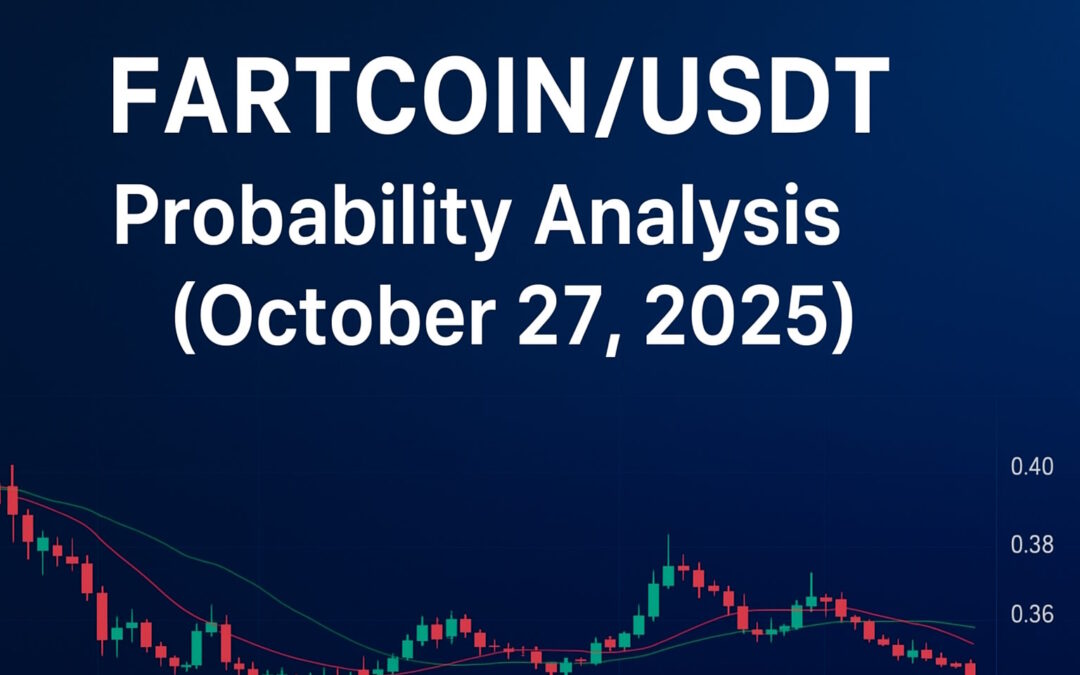
FARTCOINUSDT – Probability Analysis for October 27, 2025
FARTCOINUSDT — Probability Analysis (October 27, 2025)
Market snapshot (live data)
- Price (approx): $0.40 USD (real-time feed). (CoinMarketCap)
- Market capitalization: ~$395–400 million USD (circulating supply ≈ 1,000,000,000 FARTCOIN). (CoinMarketCap)
- 24-hour trading volume: ~$90–100 million USD (elevated vs market cap, implying strong liquidity and volatility). (CoinMarketCap)
- 24-hour price change: between −2% and +5% across price feeds (small differences between aggregators are normal). (CoinGecko)
Short executive summary
FARTCOIN/USDT is trading with strong liquidity and remains a highly sentiment-driven meme token. Price is roughly $0.40 on major aggregators, with recent intraday swings reflecting quick rotation between buyers and sellers. Overall structure on daily charts is transitioning from corrective to cautiously constructive — but weekly and monthly candle structure still require bullish confirmation to remove downside risk. (CoinMarketCap)
Detailed analysis
- Daily/ intraday view (1m → 1D)
- Price action: Intraday candles have shown volatile wicks and quick rejections at local highs. Short timeframes are dominated by scalpers; higher-low formation on 5–60 minute frames suggests buyers are present but not yet in full control. (TradingView)
- Indicators: TradingView technical summary for intraday frames reads mixed/neutral with many oscillators flat or slightly bearish — expect whipsaws until a clear breakout or breakdown. (TradingView)
- Key levels (daily):
- Support: $0.36–$0.37 (recent intraday consolidation).
- Immediate resistance: $0.42–$0.44 (recent swing highs).
- Short-term probability (next 24–72 hours):
- Consolidation / mild pullback — 55–65%: likely to see range trading between $0.36 and $0.42 unless a high-volume breakout occurs.
- Breakout continuation — 35–45%: if price clears $0.44 on volume, a run toward $0.50+ becomes possible.
- Weekly view (7D candle)
- Structure: This week’s candle is showing volatility with a relatively long upper wick on the mid-week moves, implying sellers have been active at higher levels. Weekly moving averages are flattening; a weekly close above the prior week’s body/high would materially improve the outlook. (CoinMarketCap)
- Key weekly levels:
- Support zone: $0.34–$0.36 (holds multiple intra-week lows).
- Resistance zone: $0.45–$0.48 (weekly swing top area).
- Weekly probability (next 1–2 weeks):
- Bearish / neutral continuation — 60–70%: absent a weekly close above $0.45, the more probable outcome is sideways to slight downside pressure that re-tests the $0.34–$0.36 band.
- Bullish weekly flip — 30–40%: sustained buys and a weekly close > $0.45 would indicate rotation back to trend continuation.
- Monthly view (30D candle)
- Structure & significance: Monthly candles carry the largest weight for intermediate trend. October is forming a mixed/indecisive (small-body or wick-heavy) monthly candle so far: this means the monthly bias is still delicate. A monthly close above ~$0.50 would be a strong bullish signal; conversely, a close below ~$0.34 would be bearish for multi-month horizons. (CoinMarketCap)
- Monthly probability (into November):
- Neutral to mildly bearish — 65%: unless October closes strongly (>~$0.50), there’s material risk of a weak monthly close leading to a larger corrective phase.
- Bullish re-acceleration — 35%: possible if major exchanges see continued inflows/positive listings or social momentum pushes volume higher and price reclaims larger monthly resistance levels.
- Volume, liquidity & on-chain posture
- Volume: 24-hour volumes around $90–100M are large relative to the market cap, which enables entries/exits but also means bigger directional moves can happen quickly when whales or social sentiment shift. (CoinMarketCap)
- Holder concentration & listings: Meme tokens often have concentrated holder profiles — if a few wallets hold a large portion, coordinated sells can cause sharp drops. Verify top-holder distribution in on-chain explorers before sizing positions.
- Scenario roadmap & trade management (practical rules)
- Bullish scenario (trigger & path): Clean multi-candle close above $0.44–$0.45 on expanding volume → retest as support → target $0.50–$0.60 (momentum continuation). Probability ~ 30–35% short-term. (TradingView)
- Bearish / range scenario (base case): Failure to hold $0.36–$0.37 with increasing selling volume → retest $0.30–$0.32 then consolidation. Probability ~ 65–70% short-term.
- Risk management rules (if trading): position size small (meme coin), set stop under structural support (e.g., below $0.34 if long), use partial profit-taking (e.g., scale out at $0.44 and $0.50), avoid leverage unless you accept rapid liquidation risk.
- Macro and catalysts to watch
- Bitcoin and large-cap crypto direction: liquidity rotation out of alts into BTC can quickly reduce flows into meme coins. (CoinCodex)
- Exchange listings / delistings, influencer pushes, or tokenomics announcements — any of these can flip the thesis rapidly.
- On-chain whale transfers and concentrated holder moves — monitor public wallets for large transfers.
Summary — what to watch right now
FARTCOINUSDT Oct 27 2025 FI
- Price vs. $0.36–$0.37 support band (if this fails, downside accelerates).
- Volume behavior at $0.44–$0.45 resistance (rising volume + close above = bullish trigger).
- Weekly close: a bullish weekly close above $0.45 materially improves odds of further gains; a weak weekly close increases downside risk.
- Monthly close: October’s final monthly candle will set the tone for November — closing below $0.34 would be structurally bearish. (CoinMarketCap)
Sources (live feeds & technical snapshots)
- CoinMarketCap — live price, market cap, 24h volume. (CoinMarketCap)
- TradingView — real-time charting and composite technicals. (TradingView)
- CoinGecko / CoinCodex / Kraken price feeds for cross-reference and historical context. (CoinGecko)
Important disclaimer
This analysis is informational and not financial advice. FARTCOIN is a highly speculative meme token; trade only with capital you can afford to lose and use appropriate risk controls.


