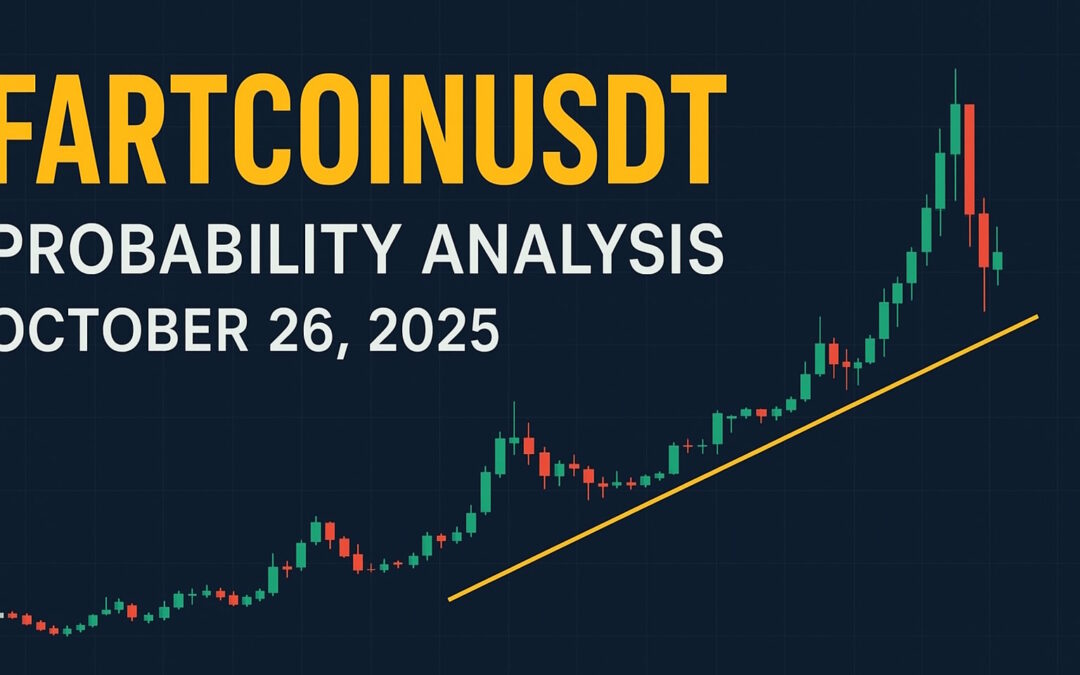
FARTCOINUSDT – Probability Analysis for October 26, 2025
FARTCOINUSDT — Probability Analysis (October 26, 2025)
Market snapshot
As of October 26 2025, the token FARTCOIN (pair FARTCOIN/USDT) is trading around $0.38 USD, with market-cap levels hovering near $380-390 million. Recent volume data suggests an elevated trading activity relative to its market cap, underscoring both liquidity and higher volatility. (CoinCodex)
Short-term summary of today’s setup
After a sequence of consolidation and corrective price action, FARTCOIN has edged higher toward ~$0.38, reflecting a modest rebound. However, from a structural view, the coin is still within a sideways/downward drift. Unless clear breakout signals appear (volume surge, sustained close above key resistances) the risk remains tilted toward further consolidation or pullback.
Key price levels to watch
Support levels:
- Approx. $0.34-$0.35: The immediate short-term support band.
- Approx. $0.30: A deeper support target if the first band fails.
Resistance levels: - Approx. $0.38-$0.40: Near-term resistance zone where past upward moves stalled.
- Approx. $0.45+: A breakout target, only realistic if momentum returns strongly.
Technical read (indicator summary)
On intraday to 4-hour timeframes, price action is showing modestly higher lows, which may reflect accumulation or a slow build of buyer interest. On daily charts, moving averages remain above price or are flattening, hinting that the bullish trend hasn’t been reclaimed yet. Momentum oscillators (like RSI/MACD) remain neutral/weak-bullish but lack strong divergence or breakout signals. The high relative volume suggests that big moves are possible, but direction remains ambiguous.
Probability Scenarios (next 24-72 hours)
Bearish / consolidation scenario (~65-70% probability):
If price fails to hold ~$0.34‐$0.35 support and closes below that area on higher volume, the path to ~$0.30 becomes increasingly likely. Without a volume-backed breakout, expect sideways to mild downside movement.
Bullish scenario (~30-35% probability):
If the token holds above ~$0.35 and then produces a clean break above ~$0.38 with rising volume, a move toward ~$0.40-$0.45 becomes viable. The trigger would be a sustained breakout and follow-through rather than a one-day spike.
Weekly / Monthly candle implications
On the weekly timeframe, the candle currently forming shows price hovering near its lower end with resistance still active overhead—this suggests the weekly bias remains neutral-to-bearish until a breakout occurs. On the monthly level (October closing soon), unless price moves above ~$0.45 and closes strong, the risk of a weak or bearish monthly candle remains, potentially signaling a deeper correction into November.
Risk factors & watch-points
- Meme-coin dynamics: FARTCOIN’s price remains highly sentiment-driven; external news/social media can shift setup rapidly.
- Large holder concentration: If major wallets distribute, the price may drop faster than typical due to thin support.
- Broader crypto market tone: If market liquidity or risk appetite declines, speculative tokens like FARTCOIN tend to underperform.
- Chart risk: Weekly and monthly candle closes matter—if these close weak, they increase the risk of multi-week/ multi-month correction.
Trade management checklist (if trading)
- Entry: Consider entering only after confirming a hold above ~$0.35 or a breakout above ~$0.38 with volume.
- Stop-loss: For long positions, a stop below ~$0.30 keeps downside risk defined.
- Targets: For breakout scenario, partial profit at ~$0.40; further target ~$0.45+.
- Position sizing: Given high volatility, use a modest position size and manage risk accordingly.
Conclusion
For October 26, 2025, FARTCOIN/USDT remains in a vulnerable position with the higher-probability outcome being consolidation or mild downside (~65-70%). A bullish reversal (~30-35%) remains possible but hinges on clear breakout confirmation above ~$0.38-$0.40 with volume. Key support near ~$0.35 must hold to maintain upside potential; failure to do so could lead to a deeper correction. Monitor volume, broader market sentiment, and weekly/monthly closing structure closely.
Disclaimer:
The content on this website is for educational purposes only and not to be taken as financial advice. Please do your own research.


