FARTCOINUSDT – Probability Analysis for October 22, 2025
FARTCOINUSDT — Probability Analysis (October 22, 2025)
Market snapshot (live data)
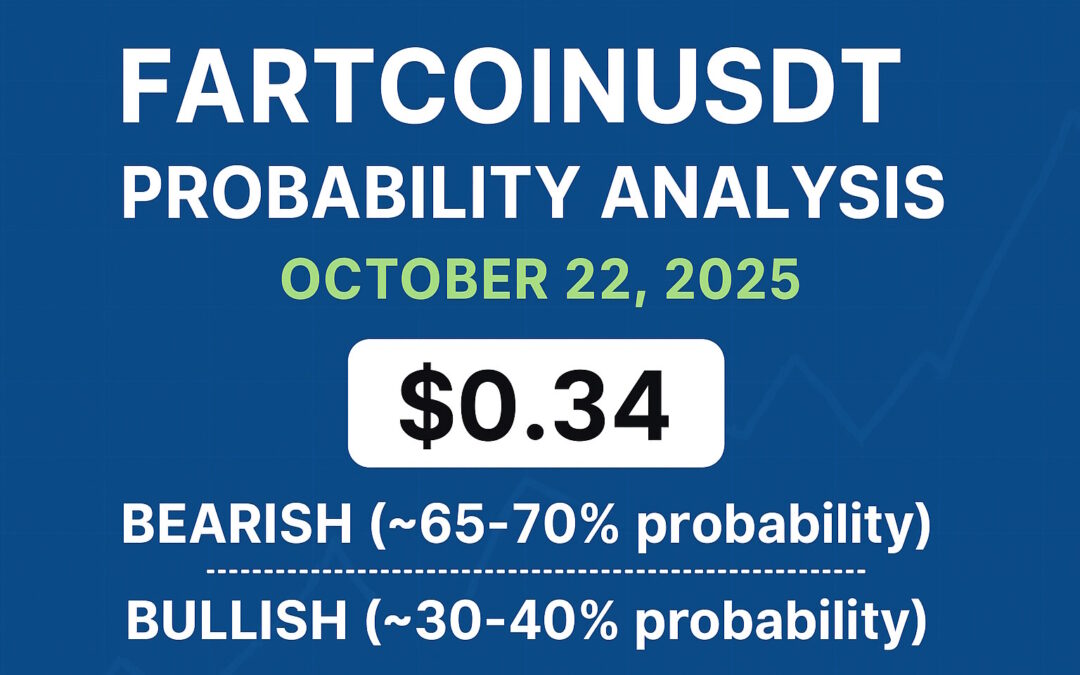
As of October 22, 2025, FARTCOIN (FARTCOIN/USDT) is trading in the mid-$0.30s with a circulating supply close to 1 billion tokens. CoinMarketCap reports the live price around $0.34 and a market capitalization roughly $345 million, with 24-hour trading volume near $95 million. (CoinMarketCap)
Short summary of the setup
Today’s market shows a continuation of the short-term corrective trend that began after mid-October. Volume remains elevated for a meme coin of this size, which keeps the pair liquid but also allows large swings when sentiment shifts. TradingView’s technical snapshot currently reads neutral-to-sell across many timeframes, indicating the bias is cautious until we see stronger bullish confirmation. (TradingView)
Key price levels to watch
Support levels:
• Immediate support: ~$0.33–$0.345 (recent intraday lows and clustered candles). (CoinMarketCap)
• Secondary support: ~$0.30 (a psychological and prior consolidation area seen on historical data). (CoinMarketCap)
Resistance levels:
• Near resistance: ~$0.38–$0.40 (recent swing highs where sell pressure reappeared). (CoinMarketCap)
• Higher resistance / breakout zone: ~$0.45 (would require sustained volume to reach). (Bitget)
Technical read (what indicators are saying)
Short timeframe (5–15 minute): Price action shows small higher lows after a dip, suggesting short-term accumulation by scalpers. Momentum oscillators on short frames are flattening, so short squeezes are possible but need volume support. (TradingView)
Hourly / 4-hour timeframe: Moving averages remain above price or are in the process of flattening. TradingView’s composite technicals show a “sell” or “neutral” bias on hourly and weekly ratings—this often means rebounds are possible but lack conviction until key moving averages are reclaimed. Watch for MACD cross confirmations on the hourly to confirm a genuine trend change. (TradingView)
Volume and liquidity
24-hour recorded volume (~$90–$100M) is high relative to the market cap, which is a double-edged sword: it makes entry/exit easier for medium-sized trades, but it also means that sudden directional volume can move price fast. High relative volume with declining price usually signals distribution; high volume with price increase signals accumulation. Current readings favor distribution/sideways movement. (CoinMarketCap)
Probability scenarios (next 24–72 hours)
Bearish / consolidation scenario — 60–70% probability
If FARTCOIN breaks and closes below the $0.33–$0.345 support area on above-average volume, the path to $0.30 (and possibly lower) opens quickly. Given the present neutral-to-sell technicals and the recent week’s down-trend, the most likely short-term outcome is rangebound action with periodic downside tests until buyers show clear strength. (TradingView)
Bullish scenario — 30–40% probability
If price holds the $0.33–$0.345 zone and we get a multi-candle close above $0.38 with expanding volume, the coin can re-test $0.40 and then $0.45. A bullish breakout requires confirmation from both volume and at least one major indicator crossover (e.g., hourly MACD or a reclaim of a 50-period MA). Until those confirmations appear, the upside remains possible but lower-probability. (TradingView)
Risk factors and watchlist
• Meme-coin volatility — sentiment and social media can move price faster than fundamentals; sudden viral activity can invalidate technicals. (Messari)
• Holder concentration — if a small number of wallets control a large supply, coordinated selling can magnify declines (on-chain data should be checked separately). (Messari)
• Broader market direction — Bitcoin dominance and overall crypto risk appetite strongly affect speculative tokens; a shift back into BTC or large caps can drain flow from smaller names. CoinMarketCap’s AI summaries recently highlighted Bitcoin dominance as a headwind during recent drops. (CoinMarketCap)
Trade management checklist (if you trade)
• Entry: Prefer to enter on a confirmed hold above $0.345 or on a breakout close above $0.38 with rising volume. (CoinMarketCap)
• Stop-loss: Place stops below the recent support cluster (for a long) — e.g., below $0.32–$0.30 depending on risk appetite.
• Targets: Partial profit at $0.39–$0.40, further target $0.45 if momentum sustains. (CoinMarketCap)
• Position sizing: Keep exposure limited; meme coins are high-volatility instruments—use small position sizes relative to capital.
Conclusion

FARTCOINUSDT Oct 22 2025 FI
Using live data from CoinMarketCap and TradingView, the immediate probability leans toward consolidation to the downside unless the $0.33–$0.345 support band holds and volume turns positive. A bullish case exists, but it needs clear confirmation through price closes above $0.38–$0.40 alongside rising traded volume. Monitor on-chain holder distribution and broader market sentiment for faster signals; treat any trade as speculative and size positions accordingly. (CoinMarketCap)
Sources
Live price, market cap and 24h volume: CoinMarketCap. (CoinMarketCap)
Technical ratings and live chart snapshots: TradingView (FARTCOIN/USDT). (TradingView)
Volume and alternative price feeds: CoinGecko and Messari. (CoinGecko)
Disclaimer:
The content on this website is for educational purposes only and not to be taken as financial advice. Please do your own research.


