
FARTCOINUSDT – Probability Analysis for October 09, 2025
FARTCOIN/USDT Probability Analysis — October 9, 2025
1. Live Snapshot & Market Context
- Recent Price Data:
- Volume & Volatility:
- The 24h volume is elevated, indicating active participation and interest in price swings. (cryptometer.io)
- Price has broken above prior resistance zones but is facing significant overhead pressure near the upper band of the intraday range.
2. Key Levels to Watch
| Level | Role | Notes |
|---|---|---|
| Support Zone | ~$0.62 – $0.66 | Floor region where buyers have earlier defended |
| Resistance / Pivot | ~$0.72 – $0.78 | Upper channel resistance where the price has reversed before |
| Breakout Threshold | > ~$0.80 | A sustained break above this would shift the bias more bullish |
| Lower Risk Zone | ~$0.55 – $0.60 | If price fails, this deeper support may be tested |
3. Probability Scenarios
Daily (Oct 9)
- Continuation / Breakout (~45%)
If buyers sustain a price above ~$0.70 with volume support, further upside toward $0.78 is possible. - Sideways / consolidation (~35%)
Price may oscillate between ~$0.62 and ~$0.74 if momentum stalls. - Pullback/reversal (~20%)
Rejection at resistance could push the price back toward support zones below.
Weekly Outlook (Oct 9–16)
- Upside push (~35%)
If sentiment holds and capital rotates in, FARTCOIN may test $0.85 region. - Range back and forth (~40%)
A trading band between $0.60–$0.78 may persist while the market decides direction. - Dip / re-test downside (~25%)
Failing to break resistance cleanly could retrace price toward $0.50+ levels.
Monthly (Next 30 days)
- Moderate recovery/repair (~40%)
A gradual climb toward $0.90+ area could happen if accumulation continues. - Mixed / sideways (~35%)
Price may stay between $0.55 to $0.85, especially if macro or sector volatility is high. - Bear reassertion (~25%)
A failure at current levels may lead to a deeper drop toward $0.45–$0.60.
4. Trade Ideas & Strategy
- Breakout play (bullish):
Entry: sustained close above ~$0.72 with strong volume
Stop: ~$0.66
Target: $0.78, then $0.85 - Resistance fade (short):
Entry: if price rejects at ~$0.78 zone with bearish candle & volume
Stop: above ~$0.80
Target: $0.66, $0.62 - Range/swing trades:
Buy near support ~$0.62 – $0.66; take profit near ~$0.74 – $0.78 - DCA accumulation:
Place small buys downward from ~$0.68 to ~$0.55; scale out when price recovers above avg + small buffer.
5. Risk Controls & Signals to Monitor
- Validate breakouts with higher-than-average volume (≥1.2×)
- Watch orderbook depth & liquidity — thin depth makes breakouts fragile
- Track exchange inflows/whale behavior — sudden large inflows = possible sell pressure
- Monitor derivatives / open interest & funding changes
- Use retest confirmations — price retesting breakout level and holding is safer entry
6. Summary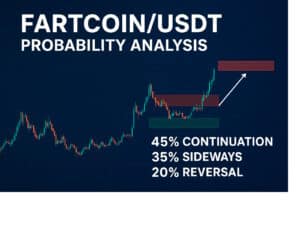
FARTCOIN/USDT is trading near $0.67 USDT with active intraday volatility and volume backing. The outlook slightly favors a continued push (~45% daily) provided resistance is cleared with strength. However, sideways or pullback scenarios remain plausible (~35–20%) pending how pthe rice behaves near pivot zones. Over the next days and weeks, the balance between accumulation and resistance strength will decide the direction.
Disclaimer:
The content on this website is for educational purposes only and not to be taken as financial advice. Please do your own research.


