
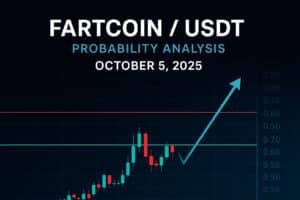
FARTCOINUSDT – Probability Analysis for October 05, 2025
FARTCOINUSDT — Probability Forecast & Outlook
Date: October 5, 2025
1. Live Snapshot & Market Context
- Current Price Estimate: ~$0.7102 USDT (TradingView composite for FARTCOIN/USDT) (TradingView)
- 24-Hour Performance: Up ~6.68% (TradingView)
- Recent Price History: On CoinMarketCap, FARTCOIN was $0.6584 on Oct 4, showing a ~1.40% drop vs prior day. (CoinMarketCap)
- Forecast Direction: CoinCodex’s medium-term model suggests ~−23% drop over the next week from current levels. (CoinCodex)
The jump in price during the last 24h suggests buyers are attempting a push, but we need to see whether that momentum holds.
2. Key Levels (Support, Resistance, Pivots)
| Role | Level (USDT) | Notes / Why Important |
|---|---|---|
| Support / Cushion | ~$0.65 – $0.68 | The recent breakout zone now acts as first line of defense for bulls |
| Resistance / Upper Pivot | ~$0.75 – $0.80 | Overhead zone where prior attempts were capped |
| Breakout / Bullish Invalidation Zone | > ~$0.90+ | If price sustains above, it signals structural shift upward |
| Fallback support | ~$0.55 – $0.60 | If current advance fails, reversion toward these levels is likely per models |
3. Probability Forecasts & Scenarios
Daily (Next 24h)
- Sustained Uptrend / Breakout Continuation (~45%)
If the current rally holds above ~$0.68 with volume confirmation, expect potential extension toward $0.75. - Pullback / Retest (~30%)
If strength fades, price may retrace to the support zone ~$0.65–$0.68 before attempting another move. - Reversal / Downside Risk (~25%)
A strong rejection near resistance may push price back toward ~$0.60 or below.
Weekly (Next 7 Days)
- Extension / Momentum Play (~35%)
If investor sentiment and volume align, FARTCOIN might test $0.80 or slightly beyond in the next few days. - Range / Consolidation (~40%)
The price might edge sideways between $0.60 to $0.80 while buyers and sellers battle for dominance. - Weakness / Pullback (~25%)
Resistance holds, and price falls back to $0.55–$0.65 band.
Monthly (30 Days)
- Moderate Recovery / Drift Higher (~40%)
If accumulation continues, FARTCOIN could inch toward $0.85 – $1.00+ over weeks. - Sideways / Mixed (~35%)
The coin may rotate within $0.60 – $0.90, reacting to macro crypto sentiment and news catalysts. - Correction / Downtrend Reasserted (~25%)
If this rally fails and selling pressure returns, price could reassert a downward path toward $0.45 – $0.65.
4. Trade & Strategy Ideas
- Breakout continuation (bullish play):
Entry: on confirmation that price holds above ~$0.68 with volume momentum
Stop: ~$0.62–$0.65
Targets: $0.75, $0.80, stretch to $0.90 - Fade / resistance short:
Entry: near resistance zone (~$0.75–$0.80) if you see a rejection candle + volume reversal
Stop: above $0.82–$0.85
Targets: $0.68, $0.60 - Range / swing trades:
Buy near support (~$0.65–$0.68), sell near resistance ($0.75–$0.80), with tight stop losses. - DCA / accumulation plan:
If you believe in a sustained bullish path, place small tranches from ~$0.68 downward (e.g. $0.68, $0.66, $0.64) and exit (or scale out) once price recovers avg cost + $0.03–$0.05.
5. Risk Controls & Watch Indicators
- Volume strength: breakouts must come with volume > 1.2× average to be credible.
- Orderbook / liquidity: ensure there are buy orders under support zones, not just single sweeps.
- Exchange flows / whale activity: large deposits or transfers to exchanges may be red flags.
- Derivatives / open interest / funding: a spike in short interest or negative funding can undermine rallies.
- Failure at resistance or reversal candles: if price fails around $0.75–$0.80 with heavy sell volume, the risk is a sharper pullback.
6. Summary & Outlook
- Current price (~$0.7102) shows bulls have made a strong day’s push. (TradingView)
- The daily probability slightly favors continuation of the uptrend (~45%), though pullback and reversal scenarios still carry meaningful weight.
- On the weekly and monthly horizon, the path of least resistance could lean upward if momentum sustains, but the risk of failure at resistance remains real.
- Use incremental size, require volume confirmation, and don’t assume breakouts unless they clear price + retest levels cleanly.
Disclaimer:
The content on this website is for educational purposes only and not to be taken as financial advice. Please do your own research.


