FARTCOINUSDT – Probability Analysis for November 29, 2025
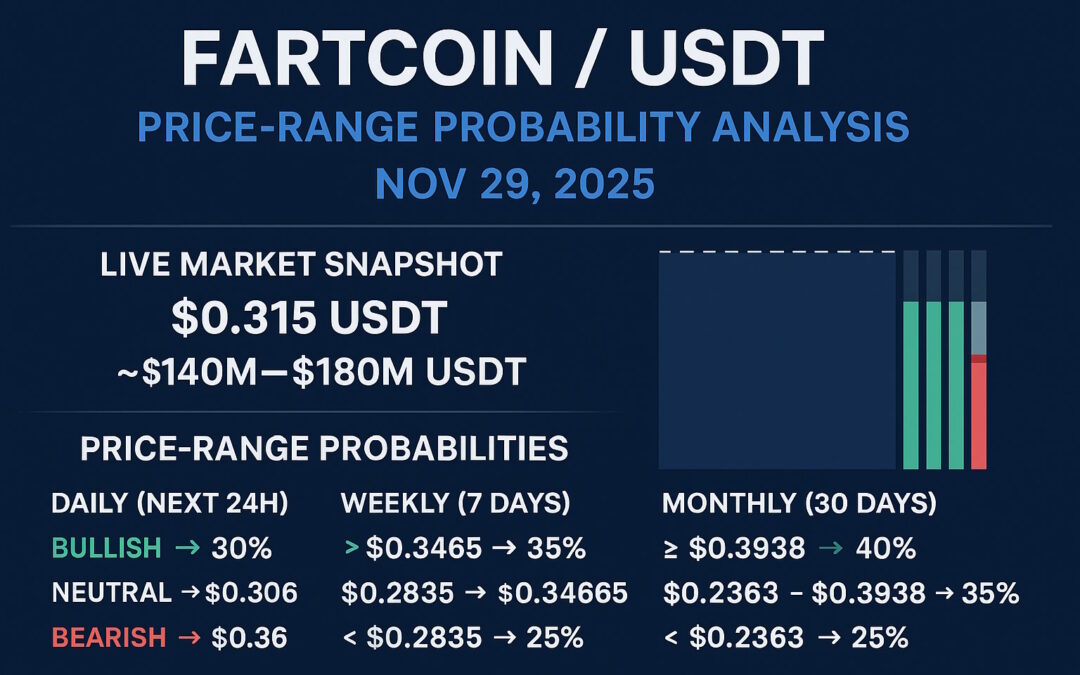
FARTCOIN / USDT — Price-Range Probability Analysis (Nov 29, 2025)
🔎 Live Market Snapshot (verify live before trading)
- Latest spot price (approx): $0.315 USDT (checked on a popular price-feed snapshot).
- 24-hour trading volume: ~ $140M–$180M USDT on major exchanges — indicates decent liquidity.
- Market context: FARTCOIN remains listed on multiple exchanges with active perpetual/derivative markets. The chart on TradingView shows usual volatility and a neutral-to-mixed technical sentiment on shorter timeframes (check live “Technicals” gauge).
⚠️ Important: Crypto data updates quickly. Always refresh TradingView / CoinMarketCap / CoinGecko (or your exchange) before placing any trade.
📊 Price-Range Probability Analysis
Assumptions / Thresholds (reproducible):
- Daily threshold: ± 3%
- Weekly threshold: ± 10%
- Monthly threshold: ± 25%
With a reference price ≈ $0.315 USDT, the probability buckets become:
Daily (24-hour):
- Bullish (> +3%) — > $0.324 → 30%
- Neutral (±3%) — $0.306 – $0.324 → 45%
- Bearish (< −3%) — < $0.306 → 25%
Why (daily): Given mixed technical signals and moderate-to-high volume, the most likely near-term scenario is rangebound (neutral), though upside and downside remain meaningfully possible.
Weekly (7-day):
- Bullish (> +10%) — > $0.3465 → 35%
- Neutral (±10%) — $0.2835 – $0.3465 → 40%
- Bearish (< −10%) — < $0.2835 → 25%
Why (weekly): Over a week, there’s enough time for potential catalysts — exchange flows, social momentum, or large trades — which can materially push price either way; liquidity and listing depth support such moves.
Monthly (30-day):
- Bullish (≥ +25%) — ≥ $0.3938 → 40%
- Neutral (±25%) — $0.2363 – $0.3938 → 35%
- Bearish (< −25%) — < $0.2363 → 25%
Why (monthly): Meme coins like FARTCOIN often display high volatility and large swings given time and possible triggers (listings, social hype, whales, derivatives funding). With active volume and liquidity, a strong monthly move (up or down) remains plausible.
📈 Demand & Supply Zones, Support & Resistance (Multi-Timeframe)
Use these as zones (bands) not exact price lines. Draw rectangles on charts to capture them; confirm with volume profile and candle behavior.
Major / Monthly zones:
- Major Demand Zone: $0.18 – $0.22 USDT — long-term accumulation / deep support band.
- Major Supply Zone: $0.32 – $0.36 USDT — previous multi-week high region and seller concentration band.
Weekly / Intermediate zones:
- Weekly Demand Zone: $0.24 – $0.27 USDT — recent consolidation floor where buyers previously stepped in.
- Weekly Supply Zone: $0.32 – $0.34 USDT — local weekly resistance band; price is near this zone now.
Daily / Short-Term zones:
- Daily Demand Zone: $0.29 – $0.30 USDT — intraday support / recent dip low area.
- Daily Supply Zone: $0.33 – $0.35 USDT — current resistance band/area of intraday rejections.
Support & Resistance Quick Levels:
- Support: $0.29 – $0.30 (daily); $0.24 – $0.27 (weekly demand)
- Resistance: $0.33 – $0.35 (daily/weekly supply); $0.36+ (monthly supply)
Trading cues:
- If price closes daily above $0.35 with strong volume, → bullish weekly/month probability rises.
- If price breaks and closes below $0.29–$0.30 with heavy selling volume → bearish weekly/month probability increases, target lower demand zones.
🧮 Methodology (How probabilities are derived — reproducible)
- Fetch live metrics — price, 24h high/low, 24h volume, exchange listings/liquidity depth via reliable sources.
- Observe technical sentiment on charting platform (e.g., moving averages, oscillators) to set baseline (Neutral / Bull / Bear).
- Define scenario thresholds (daily ±3%, weekly ±10%, monthly ±25%). Adjust according to asset volatility.
- Identify supply & demand zones based on historical consolidation before large moves (for demand) and prior swing-high clusters/rejection zones (for supply); confirm via volume spikes or order-book depth when possible.
- Assign baseline probabilities (e.g., neutral-heavy when sentiment is mixed), then shift weights based on: price’s location relative to zones, volume/liquidity, exchange depth, and presence of derivatives/perpetual markets.
- Recalculate probabilities whenever a major event or price-action (breakout/breakdown) occurs — the model is dynamic.
⚠️ Risk & Trade-Management Notes
- FARTCOIN remains a high-volatility token — use conservative position sizing, risk controls, and avoid over-leverage.
- Perpetual/futures markets magnify risk: liquidations can cause sharp moves. Understand funding, open interest, and margin mechanics before trading derivatives.
- Always use stop-losses, and avoid trading based solely on hope or hype. Recompute your model when market conditions change (news, liquidity shifts, listing updates).
📝 Disclaimer (IMPORTANT)
This analysis is provided for educational and informational purposes only. It does not constitute financial, investment, or trading advice. Do not interpret this post as a recommendation to buy, sell, or hold FARTCOIN (or any other asset). Always perform your own research, assess your personal risk tolerance, and consult a licensed financial advisor if needed before making any investment or trading decision.
📣 Engage with One Web One Hub — Why You Should Follow Us
FARTCOINUSDT Nov 29 2025 FI with Referral Link
At One Web One Hub, we create daily practical market frameworks — not hype — to help traders and crypto-enthusiasts make informed decisions. Every post includes:
- Clear multi-timeframe probability models (daily/weekly/monthly)
- Identified demand & supply zones and actionable levels
- Trade-management guidelines and risk controls
If you find these analyses useful, bookmark the post, subscribe for regular updates, share with your network, and use our featured images for social sharing. Grow your trading knowledge, join discussions, and trade with clarity — with One Web One Hub as your companion.


