ADAUSDT – Probability Analysis for May 18, 2026
ADAUSDT Price Analysis – May 18, 2026
Current Market Overview
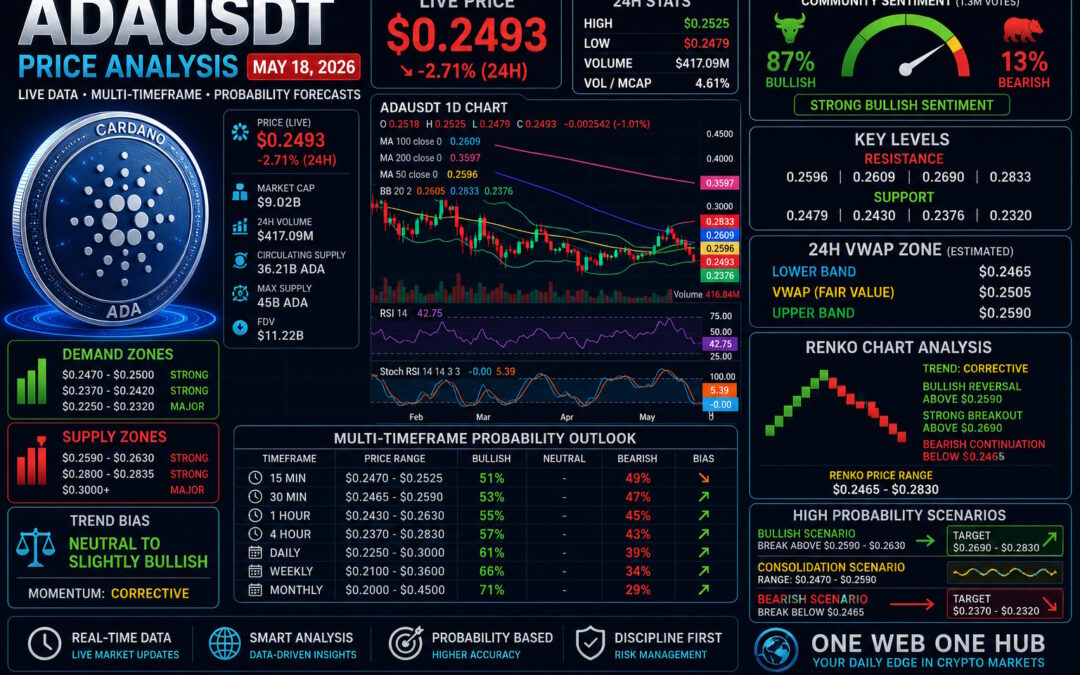
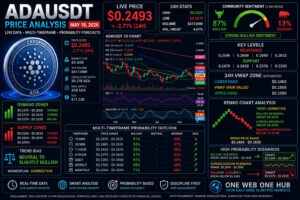
ADAUSDT is currently trading near $0.2493, reflecting a -2.71% decline over the last 24 hours. Cardano is experiencing short-term corrective pressure after failing to sustain momentum above the recent local highs near $0.2800.
Live Market Snapshot
-
Current Price: $0.2493
-
24H Change: -2.71%
-
24H Volume: ~$417M
-
Market Cap: ~$9.02B
-
Community Sentiment: 87% Bullish / 13% Bearish
Although price has pulled back, bullish sentiment remains dominant, suggesting many traders still expect continuation after stabilization.
Market Structure Analysis
Short-Term Trend
Lower timeframes show bearish retracement pressure after rejection near the upper Bollinger Band region.
Mid-Term Trend
The 4H structure remains inside a consolidation range between $0.2370 and $0.2830.
Long-Term Trend
ADA continues to hold above major macro accumulation zones, preserving the broader recovery structure.
Demand and Supply Zones
Demand Zones
-
$0.2470 – $0.2500 → Immediate demand zone
-
$0.2370 – $0.2420 → Strong buyer support
-
$0.2250 – $0.2320 → Major accumulation area
Supply Zones
-
$0.2590 – $0.2630 → Immediate resistance zone
-
$0.2800 – $0.2835 → Strong supply zone
-
$0.3000+ → Macro resistance
Support and Resistance Levels
Support Levels
-
$0.2479
-
$0.2430
-
$0.2376
-
$0.2320
Resistance Levels
-
$0.2596
-
$0.2609
-
$0.2690
-
$0.2833
24H VWAP Analysis
Estimated VWAP Zone
Using visible candle clustering, average trade positioning, and intraday equilibrium estimation:
-
Lower VWAP Band: $0.2465
-
VWAP Fair Value: $0.2505
-
Upper VWAP Band: $0.2590
VWAP Interpretation
-
Above $0.2590 → Bullish expansion phase
-
Around $0.2505 → Balanced market conditions
-
Below $0.2465 → Sellers gaining control
Current price trading slightly below estimated VWAP fair value indicates temporary weakness but not full bearish breakdown.
Multi-Timeframe Price Probability Analysis
15-Minute Timeframe
Range
$0.2470 – $0.2525
Probability
-
Bullish Bounce: 51%
-
Bearish Continuation: 49%
Price is stabilizing near short-term support.
30-Minute Timeframe
Range
$0.2465 – $0.2590
Probability
-
Bullish: 53%
-
Bearish: 47%
Momentum remains mixed but recovery attempts are visible.
1-Hour Timeframe
Range
$0.2430 – $0.2630
Probability
-
Bullish Recovery: 55%
-
Bearish Continuation: 45%
Holding above $0.2470 improves bullish recovery chances.
4-Hour Timeframe
Range
$0.2370 – $0.2830
Probability
-
Bullish: 57%
-
Bearish: 43%
The broader range structure remains constructive.
Daily Timeframe
Range
$0.2250 – $0.3000
Probability
-
Bullish Expansion: 61%
-
Bearish Continuation: 39%
Daily structure still favors medium-term recovery.
Weekly Timeframe
Range
$0.2100 – $0.3600
Probability
-
Bullish Macro Recovery: 66%
-
Bearish Outlook: 34%
Weekly structure remains positive while above major support.
Monthly Timeframe
Range
$0.2000 – $0.4500
Probability
-
Bullish Long-Term Recovery: 71%
-
Bearish Continuation: 29%
Macro accumulation structure remains intact.
Renko Chart Analysis
Renko Trend Status
Recent Renko bricks suggest short-term bearish correction after a bullish impulse wave.
Key Renko Levels
-
Bullish Reversal Trigger: Above $0.2590
-
Strong Breakout Confirmation: Above $0.2690
-
Bearish Continuation Trigger: Below $0.2465
Renko Price Range
$0.2465 – $0.2830
Renko structure still supports a broader bullish outlook unless support breaks decisively.
Sentiment Analysis
Market Sentiment
-
Bullish Sentiment: 87%
-
Bearish Sentiment: 13%
Sentiment Interpretation
Despite short-term price weakness, the broader crypto community remains optimistic on ADA’s recovery potential. Historically, strong bullish sentiment combined with corrections often creates volatility before continuation.
Sentiment Price Zones
-
Bullish Zone: $0.2590 – $0.2830
-
Neutral Zone: $0.2470 – $0.2590
-
Bearish Zone: Below $0.2465
Basis of Probability Analysis
Inputs Used for Analysis
-
Live ADAUSDT chart structure
-
Volume and volatility analysis
-
RSI and Stochastic RSI momentum readings
-
Bollinger Band positioning
-
Estimated VWAP equilibrium zones
-
Renko trend continuation analysis
-
Community sentiment data
-
Multi-timeframe support/resistance confluence
Methodology
Probabilities are derived from weighted technical confluence rather than single-indicator forecasting. The more aligned indicators become, the stronger the directional probability.
High Probability Trading Scenarios
Bullish Scenario
Break above $0.2590 – $0.2630
→ Potential move toward $0.2690 – $0.2830
Consolidation Scenario
Price rotates between $0.2470 – $0.2590 while building liquidity.
Bearish Scenario
Break below $0.2465
→ Potential downside toward $0.2370 – $0.2320
Trading Insight Summary
-
Market Bias: Neutral to Slightly Bullish
-
Momentum: Corrective Phase
-
Key Breakout Level: $0.2590
-
Key Breakdown Level: $0.2465
-
Preferred Strategy: Wait for confirmation near support or breakout retest
Disclaimer
This content is for educational and informational purposes only and should not be considered financial advice. Cryptocurrency markets are highly volatile and involve significant risk. Always conduct your own research before making financial or trading decisions.
One Web One Hub – Your Daily Crypto Knowledge Platform
18 May 2026 ADAUSDT FI (Referral Link)
One Web One Hub is dedicated to simplifying crypto analysis for traders, investors, and market learners.
What You Get
-
Daily crypto market analysis
-
Multi-timeframe forecasting
-
Educational technical breakdowns
-
VWAP and Renko insights
-
Probability-driven market outlooks
Why Readers Return Daily
Markets evolve constantly. Staying updated with structured educational analysis improves decision-making, discipline, and trading awareness over time.
Join the Community
-
Bookmark One Web One Hub
-
Visit daily for fresh ADAUSDT analysis
-
Share insights with fellow traders
-
Continue building your crypto knowledge edge every day
Previous Post ADAUSDT – Probability Analysis for May 11, 2026
Next Post ADAUSDT – Probability Analysis for May 25, 2026


