ADAUSDT – Probability Analysis for May 11, 2026
ADAUSDT Price Analysis – May 11, 2026
Current Market Overview
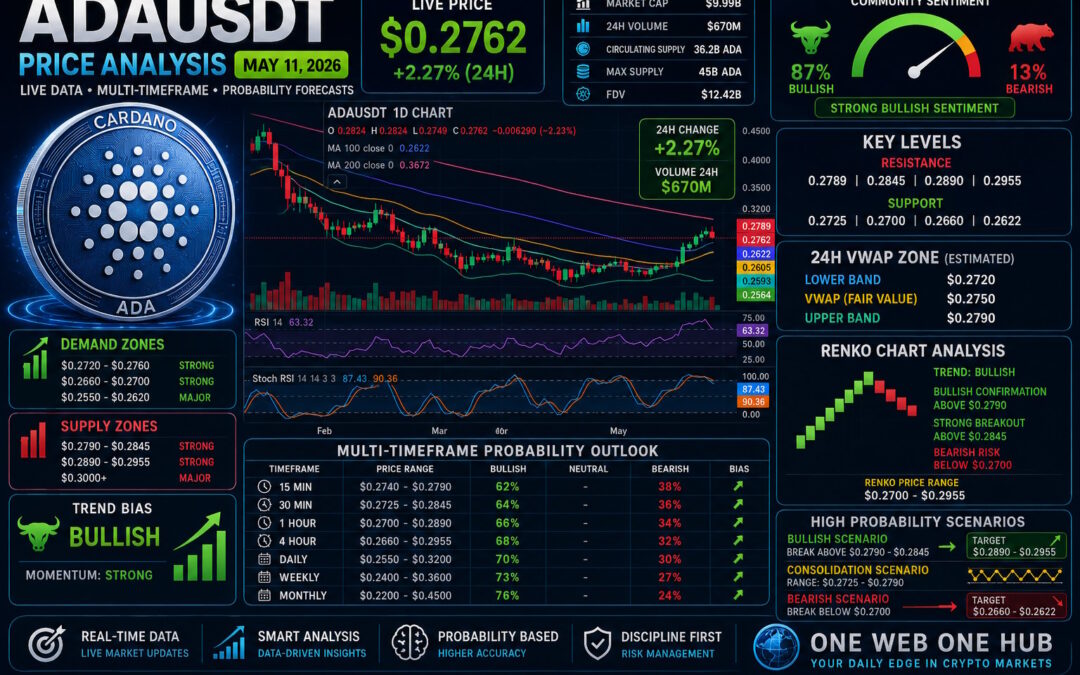
ADAUSDT is trading near $0.2762, showing strong bullish momentum with a +2.27% 24-hour gain. Cardano continues to attract buyers as volume expands sharply and price approaches an important breakout region.
Live Market Snapshot
-
Current Price: $0.2762
-
24H Change: +2.27%
-
24H Volume: ~$670M
-
Market Cap: ~$9.99B
-
Community Sentiment: Strongly Bullish
The rise in both price and volume indicates growing market participation and possible continuation toward higher resistance levels.
Market Structure Analysis
Short-Term Trend
The lower timeframes show aggressive bullish momentum after ADA reclaimed the $0.2700 region.
Mid-Term Trend
The 4H structure is forming higher lows and higher highs, signaling a developing bullish trend continuation.
Long-Term Trend
The macro trend is shifting from accumulation into recovery expansion. Sustained strength above $0.2700 may accelerate upside momentum.
Demand and Supply Zones
Demand Zones
-
$0.2720 – $0.2760 → Immediate support zone
-
$0.2660 – $0.2700 → Strong demand region
-
$0.2550 – $0.2620 → Institutional accumulation zone
Supply Zones
-
$0.2790 – $0.2845 → Immediate resistance zone
-
$0.2890 – $0.2955 → Strong supply area
-
$0.3000+ → Macro resistance zone
Support and Resistance Levels
Support Levels
-
$0.2725
-
$0.2700
-
$0.2660
-
$0.2622
Resistance Levels
-
$0.2789
-
$0.2845
-
$0.2890
-
$0.2955
24H VWAP Analysis
Estimated VWAP Zone
Using visible volume concentration and average trade positioning:
-
Lower VWAP Band: $0.2720
-
VWAP Fair Value: $0.2750
-
Upper VWAP Band: $0.2790
VWAP Interpretation
-
Above $0.2790 → Strong bullish continuation
-
Near $0.2750 → Balanced bullish market
-
Below $0.2720 → Weakness entering market
Current price trading near upper VWAP indicates bullish dominance but also warns of possible short-term volatility.
Multi-Timeframe Price Probability Analysis
15-Minute Timeframe
Range
$0.2740 – $0.2790
Probability
-
Bullish Continuation: 62%
-
Bearish Pullback: 38%
Momentum remains strong.
30-Minute Timeframe
Range
$0.2725 – $0.2845
Probability
-
Bullish: 64%
-
Bearish: 36%
Buyers remain in control above support.
1-Hour Timeframe
Range
$0.2700 – $0.2890
Probability
-
Bullish: 66%
-
Bearish: 34%
Trend continuation favored.
4-Hour Timeframe
Range
$0.2660 – $0.2955
Probability
-
Bullish: 68%
-
Bearish: 32%
Higher timeframe structure improving significantly.
Daily Timeframe
Range
$0.2550 – $0.3200
Probability
-
Bullish Recovery: 70%
-
Bearish Reversal: 30%
Daily structure confirms ongoing recovery.
Weekly Timeframe
Range
$0.2400 – $0.3600
Probability
-
Bullish Expansion: 73%
-
Sideways/Bearish: 27%
Weekly outlook remains constructive.
Monthly Timeframe
Range
$0.2200 – $0.4500
Probability
-
Macro Bullish Recovery: 76%
-
Bearish Continuation: 24%
Long-term recovery structure strengthening.
Renko Chart Analysis
Renko Trend Status
Renko structure shows multiple bullish bricks forming consecutively after reclaiming support.
Key Renko Levels
-
Bullish Confirmation: Above $0.2790
-
Strong Breakout: Above $0.2845
-
Bearish Risk: Below $0.2700
Renko Price Range
$0.2700 – $0.2955
Renko analysis strongly favors continuation while price holds above support.
Sentiment Analysis
Community Sentiment
-
Bullish sentiment remains dominant across retail communities and trading discussions.
Sentiment Interpretation
Rising volume and bullish sentiment together often indicate sustained momentum. However, extreme optimism can also create short-term shakeouts before continuation.
Sentiment Price Zones
-
Bullish Zone: $0.2790 – $0.2955
-
Neutral Zone: $0.2720 – $0.2790
-
Bearish Zone: Below $0.2700
Basis of Probability Analysis
Indicators and Data Used
-
Live price structure from market snapshot
-
Volume expansion analysis
-
RSI and Stochastic RSI momentum
-
Moving average alignment
-
Bollinger Band behavior
-
VWAP estimated equilibrium zones
-
Renko trend logic
-
Sentiment positioning
-
Multi-timeframe confluence
Methodology
Probabilities are calculated through weighted technical confluence rather than single-indicator predictions. Stronger alignment across indicators increases directional confidence.
High Probability Trading Scenarios
Bullish Scenario
Break above $0.2790 – $0.2845
→ Target: $0.2890 – $0.2955
Consolidation Scenario
Price rotates between $0.2725 – $0.2790 while building momentum.
Bearish Scenario
Break below $0.2700
→ Target: $0.2660 – $0.2622
Trading Insight Summary
-
Market Bias: Bullish
-
Momentum Strength: Strong
-
Key Breakout Level: $0.2790
-
Key Breakdown Level: $0.2700
-
Best Approach: Buy pullbacks or confirmed breakout retests
Disclaimer
This content is for educational and informational purposes only and should not be considered financial advice. Cryptocurrency markets are highly volatile and involve risk. Always conduct your own research before making investment or trading decisions.
One Web One Hub – Your Daily Crypto Intelligence Hub
11 May 2026 ADAUSDT FI (Referral Link)
At One Web One Hub, we transform live market data into educational insights designed to help traders stay informed and disciplined.
What Readers Get
-
Daily crypto analysis
-
Multi-timeframe forecasting
-
Probability-based market insights
-
Simplified technical education
-
Actionable support and resistance zones
Why Traders Keep Returning
Consistency matters in trading. Daily exposure to structured analysis improves awareness, patience, and market understanding.
Stay Connected
-
Bookmark One Web One Hub
-
Visit daily for fresh crypto insights
-
Share with your trading community
-
Continue building your market edge one chart at a time
Previous Post ADAUSDT – Probability Analysis for May 04, 2026
Next Post ADAUSDT – Probability Analysis for May 18, 2026


