FARTCOINUSDT – Probability Analysis for November 28, 2025
FARTCOINUSDT — Price-Range Probability Analysis (Nov 28, 2025)
Live snapshot (verify before trading)
- Current price (approx): $0.334 USDT. (CoinMarketCap)
- 24-hour trading volume (approx): $160M–$200M USDT across major venues. (CoinMarketCap)
- TradingView technical context/listings: FARTCOIN/USDT page shows active spot and perpetual markets, and the technical summary currently reads around Neutral on common indicator stacks (check TradingView for the live gauge). (TradingView)
Important: crypto prices and volumes update continuously — refresh TradingView / CoinMarketCap / CoinGecko (or your exchange) before placing any trade. (TradingView)
Price-range probability model (reproducible)
Thresholds used (you can reuse or adjust):
- Daily = ±3%
- Weekly = ±10%
- Monthly = ±25%
Using the reference price ≈ $0.334 USDT, these are the numeric ranges and probabilities:
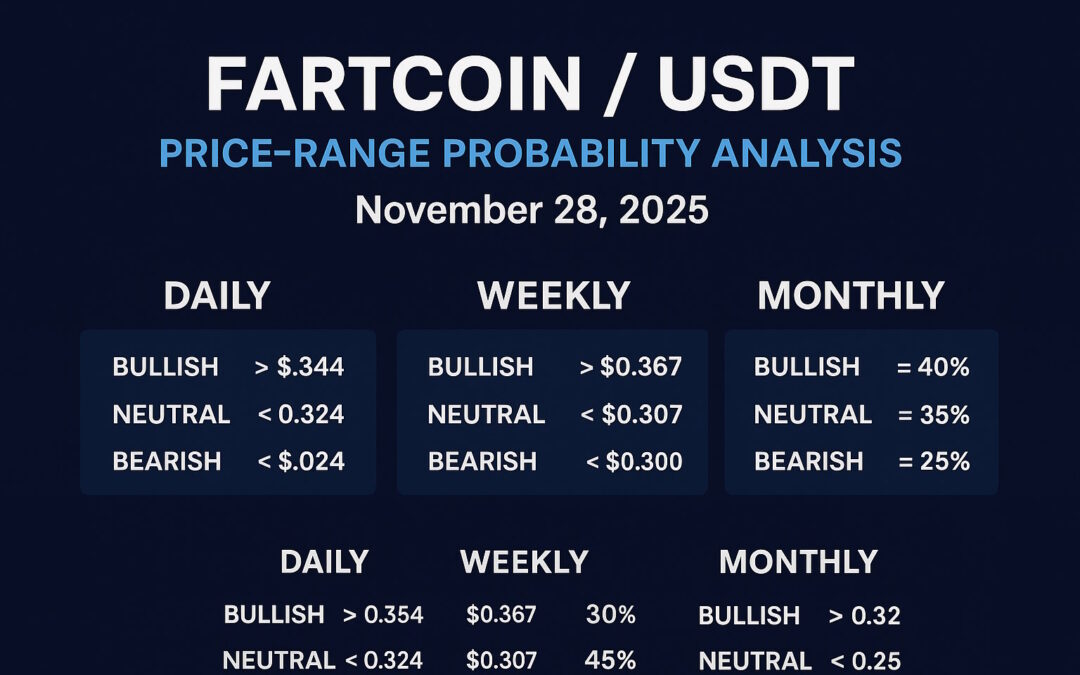
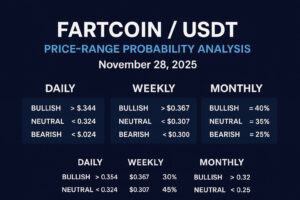
Daily (next 24 hours) — ranges & probabilities
- Bullish (price > +3%) — > $0.344 → 30%
- Neutral (within ±3%) — $0.324 – $0.344 → 45%
- Bearish (price < −3%) — < $0.324 → 25%
Rationale (daily): price sits within the recent intraday band, and TradingView shows neutral/mixed indicators; high volume supports possible moves both ways but without a clear breakout, the rangebound outcome is most likely. (TradingView)
Weekly (7 days) — ranges & probabilities
- Bullish (> +10%) — > $0.367 → 35%
- Neutral (±10%) — $0.300 – $0.367 → 40%
- Bearish (< −10%) — < $0.300 → 25%
Rationale (weekly): a 7-day window allows for exchange flows, social momentum, or news to produce clearer trends. Given listings and high liquidity, meaningful continuation is plausible; absent a catalyst, the neutral bucket still dominates. (CoinMarketCap)
Monthly (30 days) — ranges & probabilities
- Bullish (≥ +25%) — ≥ $0.418 → 40%
- Neutral (±25%) — $0.251 – $0.418 → 35%
- Bearish (< −25%) — < $0.251 → 25%
Rationale (monthly): meme tokens frequently make large monthly moves when social/listing catalysts or leveraged squeezes occur. With active volume and peri-market liquidity, the bullish tail is meaningful on a 30-day horizon while downside risk remains. (CoinGecko)
Demand & Supply zones (multi-timeframe) — where liquidity clusters
Zones are ranges — draw them as rectangles on your chart and confirm with volume/price reaction.
Monthly / Major
- Major Demand Zone: $0.18 – $0.22 USDT — deep accumulation / prior strong buyer area.
- Major Supply Zone: $0.32 – $0.36 USDT — larger multi-week peaks and seller concentration (price currently near this band). (CoinMarketCap)
Weekly / Intermediate
- Weekly Demand Zone: $0.24 – $0.28 USDT — recent consolidation where buyers re-entered.
- Weekly Supply Zone: $0.34 – $0.37 USDT — local weekly highs and rejection points. (Bitget)
Daily / Short-term
- Daily Demand: $0.30 – $0.32 USDT — intraday support region.
- Daily Supply: $0.345 – $0.355 USDT — immediate intraday resistance.
How to use zones in probabilities: when price approaches a demand zone, increase bullish probability (buyers likely to step in). When approaching a supply zone, increase bearish probability (seller congestion likely). Recompute buckets when the price decisively breaks or holds those zones. (TradingView)
Key support & resistance — quick reference
- Immediate support (short): $0.30 – $0.32 USDT (daily demand). (CoinGecko)
- Near support (weekly): $0.24 – $0.28 USDT (weekly demand).
- Immediate resistance: $0.345 – $0.355 USDT (daily supply / intraday highs). (TradingView)
- Major resistance (monthly): $0.36 – $0.40 USDT (multi-week supply cap). (CoinMarketCap)
Practical triggers to watch
- Bullish confirmation: daily close > $0.355 on expanding volume → raise weekly/monthly bullish probability materially. (TradingView)
- Bearish confirmation: decisive daily close < $0.30 on heavy selling → raise weekly/monthly bearish probability and open path to lower demand zones. (CoinGecko)
Methodology — transparent & reproducible
- Collect live inputs: current price, 24-h high/low, 24-h volume from CoinMarketCap / CoinGecko / TradingView (use exact live values in your run). (CoinMarketCap)
- Baseline sentiment: consult TradingView’s technical summary (MA/oscillators) for the timeframe to set neutral/bull/bear bias. (TradingView)
- Set thresholds: daily ±3%, weekly ±10%, monthly ±25% (tune for the asset).
- Identify zones: mark consolidation bases before impulse moves → demand; mark clusters of swing highs/rejections → supply; validate with volume spikes or orderbook depth where possible.
- Assign probabilities: start neutral-biased (e.g., neutral 45% / bullish 30% / bearish 25%) and shift weights based on: price location inside zones, volume strength, technical consensus, and presence of leveraged markets.
- Recompute whenever a major catalyst or decisive breakout/breakdown occurs — this model is meant to be rerun with fresh live inputs.
Risk & trade-management notes
- FARTCOIN is high-volatility: use conservative position sizing and strict stop rules.
- Perpetual/futures amplify risk — funding and liquidations can create sharp moves. (TradingView)
- Never risk more than you can afford to lose; for leveraged trades, understand margin and funding mechanics before entering.
Disclaimer (must read)
This content is educational and informational only. It does not constitute financial, investment, or trading advice. Do not interpret this analysis as a recommendation to buy, sell, or hold any asset. Always perform your own research, assess your personal risk tolerance, and consult a licensed financial advisor if you need tailored guidance.
Engage with One Web One Hub
FARTCOINUSDT Nov 28 2025 FI With Referral Link
At One Web One Hub, we publish daily reproducible market frameworks — probability buckets, multi-timeframe supply & demand mapping, and clear risk-management guidance so you can make objective trading decisions. Bookmark this post, subscribe for daily updates, and join our community: share ideas, challenge the probabilities, and grow your trading skillset with our practical templates.


