FARTCOINUSDT – Probability Analysis for November 26, 2025
FARTCOIN / USDT — Price-Range Probability Analysis (Nov 26, 2025)
Quick live snapshot (refresh TradingView / CoinGecko / CoinMarketCap / your exchange before trading)
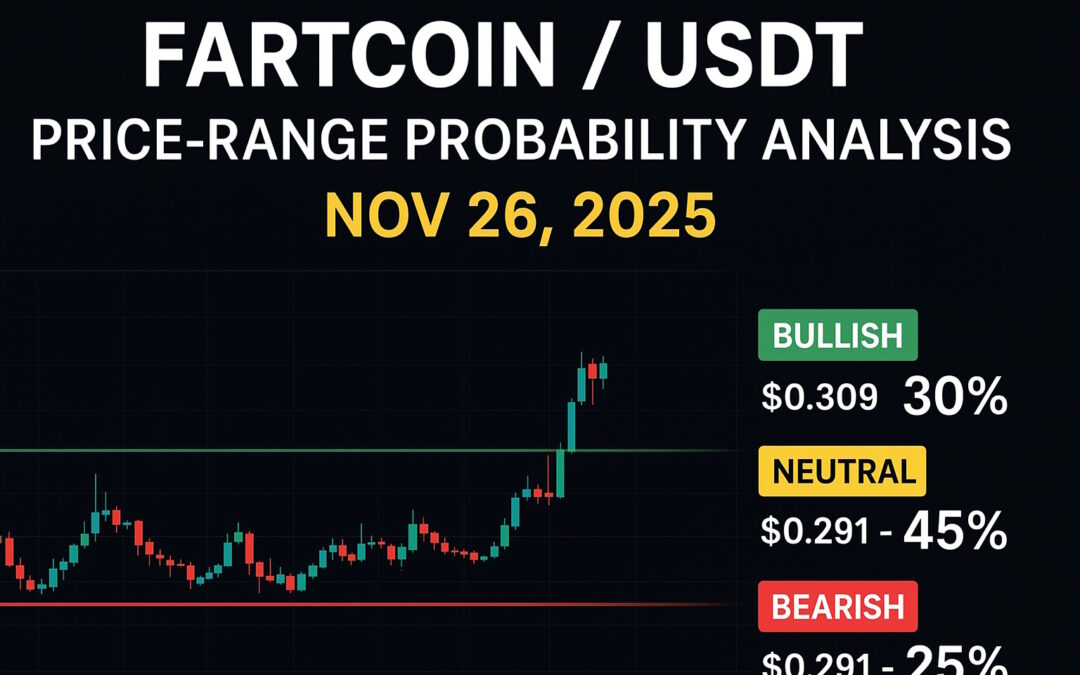
- Recent spot / perp price (sampled Nov 26, 2025): ≈ $0.30 USDT. (TradingView)
- 24-hour trading volume: very large — roughly $100M–$170M USDT on major venues (high liquidity). (CoinMarketCap)
- TradingView technical summary (multi-timeframe): currently reads broadly Neutral / Mixed (indicator consensus varies by timeframe; check the chart gauge for exact live read). (TradingView)
What this post contains
- Daily / Weekly / Monthly price-range probability buckets (numeric ranges)
- Clear explanation of the basis / methodology so you can reproduce the model with live inputs
- Demand & supply zones + support & resistance (multi-timeframe)
- Risk & trade-management notes and the required educational disclaimer
- Closing marketing paragraph to invite One Web One Hub readers to engage
Price-range probability buckets (using the observed spot ≈ $0.30)
Thresholds used (reproducible):
- Daily threshold = ±3% (short window)
- Weekly threshold = ±10% (medium window)
- Monthly threshold = ±25% (long window for a memecoin)
These thresholds are chosen to match the observed volatility profile of FARTCOIN; change them if you want tighter/wider ranges.
Daily (24-hour) — numeric ranges & probabilities
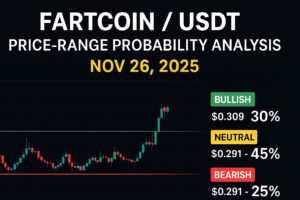
- Bullish (price > +3%) — range: > $0.309 — 30%
- Neutral (within ±3%) — range: $0.291 – $0.309 — 45%
- Bearish (price < −3%) — range: < $0.291 — 25%
Why (daily): price is trading near recent intraday highs/lows; the TradingView technicals are mixed/neutral and volume is high — that makes a rangebound outcome the single most likely short-term scenario while still leaving a meaningful bullish tail because price sits close to recent intraday highs. (TradingView)
Weekly (7-day) — numeric ranges & probabilities
- Bullish (> +10%) — range: > $0.33 — 35%
- Neutral (±10%) — range: $0.27 – $0.33 — 40%
- Bearish (< −10%) — range: < $0.27 — 25%
Why (weekly): seven days provides time for exchange-level catalysts (listings, large flows) or social momentum to build. FARTCOIN’s strong multi-exchange liquidity and active perp/futures interest increase the chance of continuation moves; absent a clear catalyst the neutral bucket remains largest. (Bitget)
Monthly (30-day) — numeric ranges & probabilities
- Bullish (≥ +25%) — range: ≥ $0.375 — 40%
- Neutral (±25%) — range: $0.225 – $0.375 — 35%
- Bearish (< −25%) — range: < $0.225 — 25%
Why (monthly): over 30 days meme tokens routinely produce sizeable moves when social momentum, listings, or leveraged squeezes occur. Given FARTCOIN’s listings and high volume, the bullish tail is the largest on the monthly horizon — but the material downside probability remains. (CoinMarketCap)
Demand & Supply zones (multi-timeframe) — where liquidity likely clusters
Treat these as zones (rectangles) on your chart, not exact price lines. Always validate on your own chart and with the volume profile.
Monthly / Major zones
- Major Demand Zone (long): $0.16 – $0.20 USDT — deep accumulation region from prior multi-week pullbacks.
- Major Supply Zone (long): $0.32 – $0.36 USDT — higher-timeframe seller congestion and prior multi-week peaks. (CoinMarketCap)
Weekly / Intermediate zones
- Weekly Demand Zone: $0.23 – $0.26 USDT — recent consolidation and the band where buyers previously stepped in. (CoinMarketCap)
- Weekly Supply Zone: $0.29 – $0.32 USDT — local weekly highs and rejection area. (Binance)
Daily / Short-term zones
- Daily Demand: $0.27 – $0.29 USDT — intraday support zone (near recent lows on some venues). (Binance)
- Daily Supply: $0.305 – $0.325 USDT — immediate intraday resistance / recent rejections. (TradingView)
Support & Resistance — quick reference levels
- Immediate support (short): $0.27 – $0.29 USDT (daily demand area). (Binance)
- Near support (weekly): $0.23 – $0.26 USDT (weekly demand). (CoinMarketCap)
- Immediate resistance: $0.305 – $0.325 USDT (daily supply / intraday highs). (TradingView)
- Key monthly resistance: $0.32 – $0.36 USDT (major supply zone). (CoinMarketCap)
Actionable cues
- Bullish trigger: a daily close above $0.325 on expanding volume → materially raises weekly/monthly bullish probabilities. (Binance)
- Bearish trigger: decisive daily close below $0.245 with heavy selling → raises weekly/monthly bearish odds and opens path toward the major demand band. (CoinMarketCap)
Basis & methodology — how these probabilities were built (reproducible)
- Collect live inputs: current spot/perp price, 24-hour high/low, and 24-hour volume from CoinGecko / CoinMarketCap / TradingView (these are the objective facts). (CoinMarketCap)
- Baseline technical sentiment: read TradingView’s “Technicals” gauge on the symbol for the timeframe you’re analyzing (Neutral/Bull/Sell). Use that to set an initial bias. (TradingView)
- Set numeric thresholds: daily ±3%, weekly ±10%, monthly ±25% (tune to the asset’s volatility).
- Identify supply/demand zones: visually mark consolidation bases preceding impulse moves (demand) and clusters of swing highs / rejection zones (supply); confirm with volume spikes on the original impulse. (Binance)
- Assign baseline probabilities: when technicals are neutral, start with neutral > bullish > bearish (e.g., 45/30/25) then adjust based on price position within zones, volume strength, and presence of leveraged markets (which amplify moves). (Bitget)
- Recompute after events: re-run the model if there’s a listing announcement, large on-chain whale movement, or a decisive breakout/breakdown — the inputs change the output quickly.
Risk & trade-management notes
- FARTCOIN is a high-volatility memecoin — keep position sizes small, always define risk, and avoid excessive leverage unless you understand margin & funding mechanics. (Bitget)
- Perpetual/futures markets can create quick liquidations — monitor funding rates and open interest if you trade perp markets. (TradingView)
- Use tight stops sized to your risk appetite and re-evaluate probabilities after any material catalyst (listing, viral mention, large whale flow).
Disclaimer (important)
This content is provided for educational and informational purposes only. It does not constitute financial, investment, or trading advice. You should not interpret this analysis as a recommendation to buy, sell, or hold any asset. Always conduct your own research, assess your personal risk tolerance, and consult a licensed financial advisor if you need professional guidance.
Engage with One Web One Hub
FARTCOINUSDT Nov 26 2025 FI With Referral Link
At One Web One Hub, we publish daily, reproducible frameworks to help traders think clearly: multi-horizon probability views, demand & supply zone mapping, and practical risk-management checklists you can apply immediately. Bookmark this post, subscribe for daily updates, share your feedback in the comments, and use our featured images to make your social posts pop. Join our community — learn the process, not the noise.
Sources / live references (verify before trading)
- TradingView — FARTCOIN/USDT (spot & perpetual pages / technicals). (TradingView)
- CoinMarketCap — live price & 24-hour volume snapshots. (CoinMarketCap)
- Binance / major exchange perp pages (price ranges & 24h high/low). (Binance)
- Bitget / market commentary on liquidity & flows. (Bitget)


